
Compare MRPL with Similar Stocks
Dashboard
High Management Efficiency with a high ROCE of 15.62%
Low ability to service debt as the company has a high Debt to EBITDA ratio of 2.46 times
Healthy long term growth as Net Sales has grown by an annual rate of 22.64% and Operating profit at 59.74%
The company has declared Positive results for the last 3 consecutive quarters
With ROCE of 16.3, it has a Very Attractive valuation with a 1.5 Enterprise value to Capital Employed
Increasing Participation by Institutional Investors
Total Returns (Price + Dividend) 
Latest dividend: 4 per share ex-dividend date: Mar-11-2026
Risk Adjusted Returns v/s
Returns Beta

News
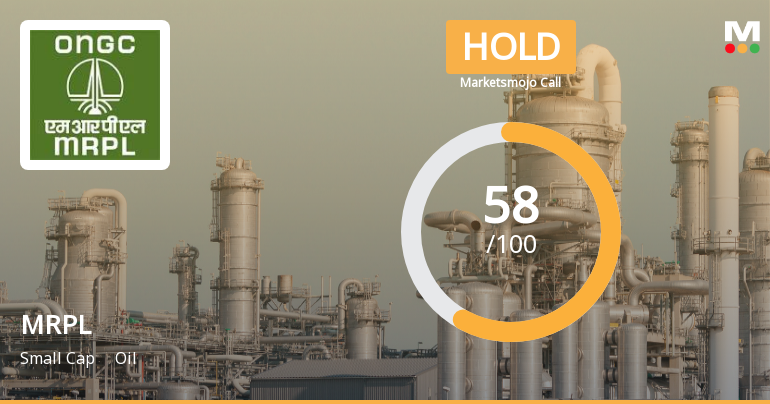
Mangalore Refinery & Petrochemicals Ltd. Downgraded to Hold Amid Mixed Technicals and Strong Valuation
Mangalore Refinery & Petrochemicals Ltd. (MRPL) has seen its investment rating downgraded from Buy to Hold as of 24 June 2026, reflecting a nuanced shift in its technical outlook despite maintaining very attractive valuation metrics and solid financial performance. The change is driven primarily by a deterioration in technical indicators, balanced against strong fundamentals and valuation improvements, prompting a more cautious stance among investors.
Read full news article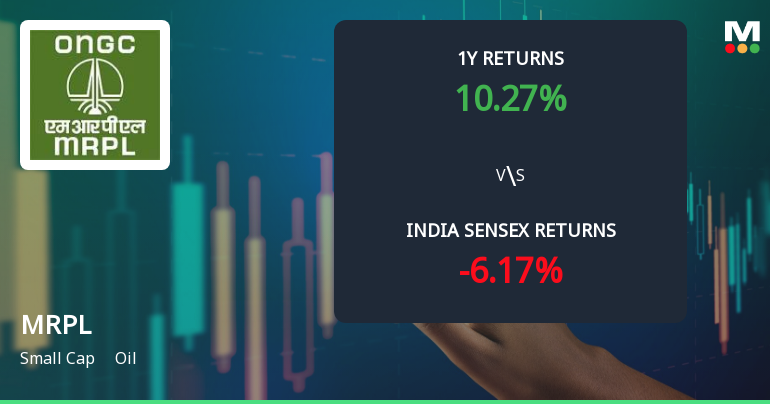
Mangalore Refinery & Petrochemicals Ltd. Technical Momentum Shifts Amid Mixed Indicators
Mangalore Refinery & Petrochemicals Ltd. (MRPL) has experienced a notable shift in its technical momentum, transitioning from a mildly bullish to a mildly bearish trend. Despite a 1.83% gain in the latest session, a detailed analysis of key technical indicators such as MACD, RSI, moving averages, and volume-based metrics reveals a complex picture for this oil sector small-cap stock.
Read full news article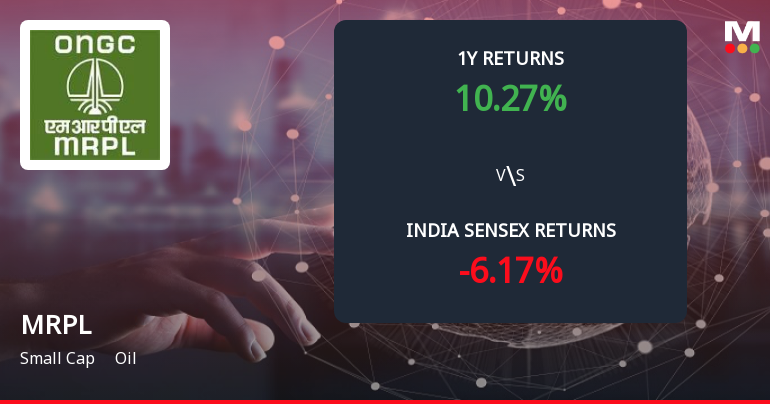
Mangalore Refinery & Petrochemicals Ltd. Forms Death Cross, Signalling Potential Bearish Trend
Mangalore Refinery & Petrochemicals Ltd. (MRPL) has recently formed a Death Cross, a significant technical indicator where the 50-day moving average (DMA) crosses below the 200-DMA. This development signals a potential shift towards a bearish trend, raising concerns about the stock’s near-term momentum and long-term strength despite its solid fundamentals and recent upgrades.
Read full news article Announcements
Mangalore Refinery and Petrochemicals Limited - Clarification
15-Nov-2019 | Source : NSEMangalore Refinery and Petrochemicals Limited Limited with respect to announcement dated 05-Nov-2019, regarding Board meeting held on November 04, 2019. On basis of above the Company is required to clarify following: 1. Brief profile (in case of appointment)
Mangalore Refinery and Petrochemicals Limited - Outcome of Board Meeting
05-Nov-2019 | Source : NSEMangalore Refinery and Petrochemicals Limited has informed the Exchange regarding Board meeting held on November 04, 2019.
Mangalore Refinery and Petrochemicals Limited - Change in Director(s)
22-Oct-2019 | Source : NSEMangalore Refinery and Petrochemicals Limited has informed the Exchange regarding Change in Director(s) of the company.
Corporate Actions

No Upcoming Board Meetings

Mangalore Refinery & Petrochemicals Ltd. has declared 40% dividend, ex-date: 11 Mar 26

No Splits history available

No Bonus history available

No Rights history available
Quality key factors
Valuation key factors
Technicals key factors
 Technical Indicator Scale: Bearish, Mildly Bearish, Sideways, Mildly Bullish, Bullish Turned
 Shareholding Snapshot : Mar 2026
Shareholding Compare (%holding)
Promoters
None
Held by 30 Schemes (0.28%)
Held by 129 FIIs (3.41%)
Oil And Natural Gas Corporation Ltd (71.63%)
Foreign Bank - The Hongkong And Shanghai Banking Corp.ltd. (0%)
5.67%
Quarterly Results Snapshot (Consolidated) - Mar'26 - QoQ

QoQ Growth in quarter ended Mar 2026 is -3.08% vs 9.11% in Dec 2025
QoQ Growth in quarter ended Mar 2026 is -91.94% vs 131.27% in Dec 2025
Half Yearly Results Snapshot (Consolidated) - Sep'25
Growth in half year ended Sep 2025 is -17.03% vs 19.31% in Sep 2024

Growth in half year ended Sep 2025 is 157.19% vs -130.18% in Sep 2024
Nine Monthly Results Snapshot (Consolidated) - Dec'25
YoY Growth in nine months ended Dec 2025 is -7.66% vs 7.69% in Dec 2024
YoY Growth in nine months ended Dec 2025 is 674.90% vs -112.79% in Dec 2024
Annual Results Snapshot (Consolidated) - Mar'26
YoY Growth in year ended Mar 2026 is -6.35% vs 4.73% in Mar 2025
YoY Growth in year ended Mar 2026 is 3,323.91% vs -98.44% in Mar 2025
About Mangalore Refinery & Petrochemicals Ltd.

Company Coordinates


