
Compare Manoj Vaibhav with Similar Stocks
Dashboard
Poor long term growth as Net Sales has grown by an annual rate of 12.98% and Operating profit at 11.30% over the last 5 years
Flat results in Mar 26
Despite the size of the company, domestic mutual funds hold only 0% of the company
Below par performance in long term as well as near term
Stock DNA
Gems, Jewellery And Watches
INR 722 Cr (Micro Cap)
6.00
48
0.00%
0.51
15.06%
0.94
Total Returns (Price + Dividend) 
Manoj Vaibhav for the last several years.
Risk Adjusted Returns v/s
Returns Beta

News
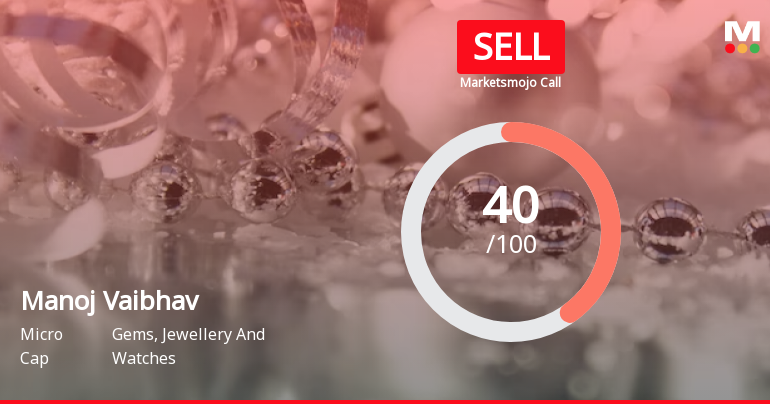
Manoj Vaibhav Gems N Jewellers Ltd is Rated Sell
Manoj Vaibhav Gems N Jewellers Ltd is rated Sell by MarketsMOJO. This rating was last updated on 22 May 2026, reflecting a change from the previous Hold rating. However, all fundamentals, returns, and financial metrics discussed here are current as of 20 June 2026, providing an up-to-date view of the stock’s position in the market.
Read full news article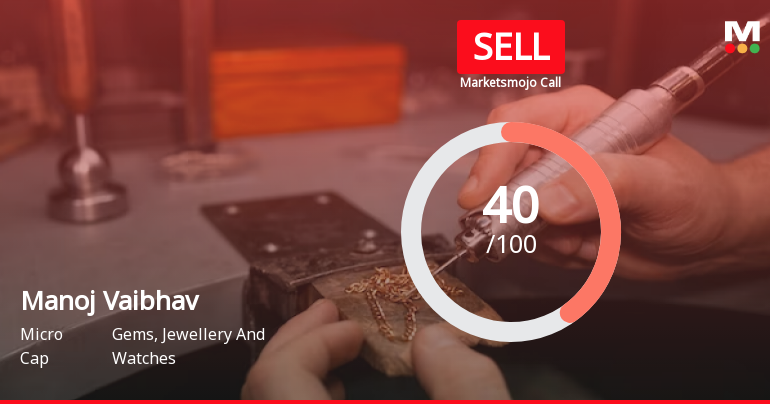
Manoj Vaibhav Gems N Jewellers Ltd is Rated Sell
Manoj Vaibhav Gems N Jewellers Ltd is rated Sell by MarketsMOJO, with this rating last updated on 22 May 2026. However, the analysis and financial metrics presented here reflect the stock's current position as of 09 June 2026, providing investors with the latest insights into the company’s performance and outlook.
Read full news article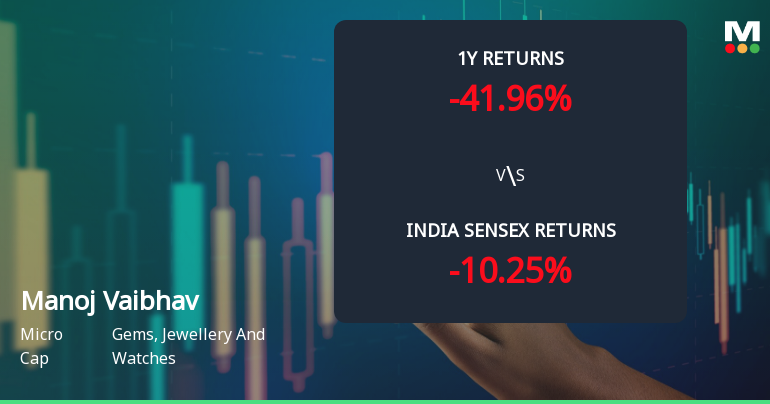
Manoj Vaibhav Gems N Jewellers Ltd Faces Bearish Momentum Amid Technical Downgrade
Manoj Vaibhav Gems N Jewellers Ltd, a micro-cap player in the Gems, Jewellery and Watches sector, has experienced a notable shift in technical momentum, with key indicators signalling a bearish trend. The stock’s recent downgrade from a Hold to a Sell rating by MarketsMOJO reflects deteriorating technical conditions amid sustained price weakness and underperformance relative to the broader market.
Read full news article Announcements
Board Meeting Outcome for Outcome Of Board Meeting-Approval Of Audited Financial Results And Appointment Of Internal Auditor
22-May-2026 | Source : BSEThe Board of directors at its meeting held today May 22 2026 approved the audited financial statements for the 4th Quarter ended march 31 2026 and approved the appointment of internal auditor
Compliances-Reg.24(A)-Annual Secretarial Compliance
22-May-2026 | Source : BSEWe hereby submit the annual secretarial compliance report for FY ended March 31 2026.
Results-Audited Financial Results For The 4Th Quarter And Year Ended March 31 2026
22-May-2026 | Source : BSEAudited Financial Results for the 4th Quarter and year ended March 31 2026
Corporate Actions

No Upcoming Board Meetings

No Dividend history available

No Splits history available

No Bonus history available

No Rights history available
Quality key factors
Valuation key factors
Technicals key factors
 Technical Indicator Scale: Bearish, Mildly Bearish, Sideways, Mildly Bullish, Bullish Turned
 Shareholding Snapshot : Mar 2026
Shareholding Compare (%holding)
Promoters
None
Held by 0 Schemes
Held by 1 FIIs (0.6%)
Grandhi Bharata Mallika Ratna Kumari Huf(bharata Mallika Ratna Kumari Grandhi) (54.35%)
Collate Dealers Private Limited (1.65%)
17.6%
Quarterly Results Snapshot (Standalone) - Mar'26 - QoQ

QoQ Growth in quarter ended Mar 2026 is 10.17% vs -9.40% in Dec 2025

QoQ Growth in quarter ended Mar 2026 is -18.38% vs 8.73% in Dec 2025
Half Yearly Results Snapshot (Standalone) - Sep'25
Growth in half year ended Sep 2025 is 10.45% vs 4.71% in Sep 2024
Growth in half year ended Sep 2025 is 8.03% vs 16.98% in Sep 2024
Nine Monthly Results Snapshot (Standalone) - Dec'25
YoY Growth in nine months ended Dec 2025 is 18.50% vs 4.72% in Dec 2024
YoY Growth in nine months ended Dec 2025 is 17.83% vs 22.07% in Dec 2024
Annual Results Snapshot (Standalone) - Mar'26
YoY Growth in year ended Mar 2026 is 15.10% vs 10.90% in Mar 2025
YoY Growth in year ended Mar 2026 is 14.49% vs 24.09% in Mar 2025
About Manoj Vaibhav Gems N Jewellers Ltd

Company Coordinates


