Marathon Nextgen

INR
408.75
-5.8 (-1.4%)
BSENSE

Sep 18, 03:30 PM

BSE+NSE Vol: 90.65 k

  • Price Points
  • Score
  • Mojo Parameters
  • Total Return
  • News and Corporate Actions
  • Key factors
  • Shareholding
  • Financials
  • CompanyCV
stock-summaryPrice Point
High/Low

1Day

52 Week

Valuation
Technical
Day's Volume

CASH

90.65 k (18.01%) Volume

Shareholding (Jun 2026)

FII

4.68%

Held by 22 FIIs

DII

14.71%

Held by 11 DIIs

Promoter

56.42%

Which are the latest news on Marathon Nextgen?

18-Sep-2026

Why is Marathon Nextgen Realty Ltd falling/rising?

06-Sep-2026

As of 05-Sep, Marathon Nextgen Realty Ltd's stock price is currently at 439.00, reflecting a recent upward trend with a 4.55% gain over the past week. Despite a year-to-date decline of 20.99%, increased investor interest and strong short-term performance indicate a potential shift in sentiment.

As of 05-Sep, Marathon Nextgen Realty Ltd's stock price is rising, currently at 439.00, with a change of 1.5 (0.34%) increase. The stock has shown strong performance over the past week, gaining 4.55%, while the benchmark Sensex has declined by 0.97%. Additionally, in the last month, the stock has increased by 12.52%, contrasting with a 2.44% drop in the Sensex.<BR><BR>Today's performance indicates that the stock has outperformed its sector by 0.72% and has been on a consecutive gain for the last two days, rising by 1.2% during this period. The stock reached an intraday high of Rs 449, reflecting a 2.63% increase. Furthermore, there has been a notable rise in investor participation, with delivery volume increasing by 50.91% compared to the 5-day average, indicating growing interest among investors.<BR><BR>Despite the positive short-term trends, it is important to note that the stock has underperformed over the longer term, with a year-to-date decline of 20.99% and a one-year drop of 28.07%. However, the recent upward movement in price can be attributed to the stock's strong performance relative to the market and increased trading activity, which suggests a shift in investor sentiment.

View full answer

Who are in the management team of Marathon Nextgen?

01-Sep-2026

The management team of Marathon Nextgen includes Chetan R Shah (Chairman & Managing Director), Mayur R Shah (Vice Chairman), S Ramamurthi (Whole Time Director & CFO), and several independent directors, overseeing the company's strategic direction and operations.

The management team of Marathon Nextgen includes the following key members:<BR><BR>1. **Chetan R Shah** - Chairman & Managing Director<BR>2. **Mayur R Shah** - Vice Chairman<BR>3. **S Ramamurthi** - Whole Time Director & CFO<BR>4. **K S Raghavan** - Company Secretary & Compliance Officer<BR>5. **Shailaja C Shah** - Director<BR>6. **Deepak R Shah** - Independent Director<BR>7. **Parul Shah** - Independent Director<BR>8. **Atul Mehta** - Independent Director<BR>9. **Ashwin Mohan Thakke** - Independent Director<BR><BR>This team is responsible for overseeing the strategic direction and operational management of the company.

View full answer

What does Marathon Nextgen do?

01-Sep-2026

Marathon Nextgen Realty Ltd is a small-cap real estate company, incorporated in 1978, with a market cap of INR 2,835 Cr and reported net sales of 198 Cr and net profit of 50 Cr for June 2026. Key metrics include a P/E of 14.00 and a return on equity of 8.99%.

Overview: <BR>Marathon Nextgen Realty Ltd operates in the realty industry and is categorized as a small-cap company.<BR><BR>History: <BR>The company was incorporated in 1978 as Piramal Spinning & Weaving Mills Limited. It underwent several name changes, becoming Marathon Nextgen Realty and Textiles Limited in 2003 and later Marathon Nextgen Realty Limited in 2007. The latest quarterly results report net sales and net profit for June 2026.<BR><BR>Financial Snapshot: <BR>Net Sales: 198 Cr (Quarterly Results - Jun 2026) <BR>Net Profit: 50 Cr (Quarterly Results - Jun 2026) <BR>Market Cap: INR 2,835 Cr (Small Cap)<BR><BR>Key Metrics: <BR>P/E: 14.00 <BR>Industry P/E: 36 <BR>Dividend Yield: 0.24% <BR>Debt Equity: -0.13 <BR>Return on Equity: 8.99% <BR>Price to Book: 1.25 <BR><BR>Contact Details: <BR>Address: Futurex N M Joshi Marg, Nr Railway Station Lower Parel Mumbai Maharashtra : 400013 <BR>Tel: 91-22-672488585/61588484 <BR>Email: shares@marathonnextgen.com <BR>Website: http://www.marathonnextgen.com

View full answer

Who are the peers of the Marathon Nextgen?

01-Sep-2026

Marathon Nextgen's peers include AGI Infra, TARC Ltd, Arvind SmartSp., EFC (I), Elpro Internatio, Hubtown, Alembic, Omaxe, Arkade, and Ajmera Realty. In terms of management risk, growth, and capital structure, Marathon Nextgen is rated average, with a 1-year return of -35.15%, lower than its peers.

Peers: The peers of Marathon Nextgen are AGI Infra, TARC Ltd, Arvind SmartSp., EFC (I), Elpro Internatio, Hubtown, Alembic, Omaxe, Arkade, and Ajmera Realty.<BR><BR>Quality Snapshot: Excellent management risk is observed at Arvind SmartSp., while Average management risk is found at AGI Infra, Marathon Nextgen, Alembic, and Arkade, and Below Average management risk is noted at TARC Ltd, EFC (I), Elpro Internatio, Hubtown, and Omaxe. Growth is Excellent at Arvind SmartSp. and EFC (I), Good at Alembic, Average at Marathon Nextgen, AGI Infra, and Hubtown, and Below Average at TARC Ltd, Omaxe, and Arkade. Capital Structure is Excellent at Alembic, Good at AGI Infra and Marathon Nextgen, and Below Average at TARC Ltd, EFC (I), Elpro Internatio, Hubtown, Omaxe, and Ajmera Realty.<BR><BR>Return Snapshot: The peer with the highest 1-year return is Elpro Internatio at 108.64%, while the peer with the lowest is TARC Ltd at -22.97%. Marathon Nextgen's 1-year return of -35.15% is lower than both. Additionally, the six-month return is negative for EFC (I), Hubtown, and Ajmera Realty.

View full answer

How big is Marathon Nextgen?

01-Sep-2026

As of 31st August, Marathon Nextgen Realty Ltd has a market capitalization of 2,835.00 Cr, with recent Net Sales of 552.80 Cr and a Net Profit of 193.31 Cr.

As of 31st August, Marathon Nextgen Realty Ltd has a market capitalization of 2,835.00 Cr, categorizing it as a Small Cap company.<BR><BR>In the latest four quarters, the company reported Net Sales of 552.80 Cr and a Net Profit of 193.31 Cr.<BR><BR>The latest annual period for the balance sheet is March 2025, with Shareholder's Funds amounting to 1,186.98 Cr and Total Assets of 2,094.96 Cr.

View full answer

Should I buy, sell or hold Marathon Nextgen Realty Ltd?

08-Aug-2026

Are Marathon Nextgen Realty Ltd latest results good or bad?

29-May-2026

Marathon Nextgen Realty Ltd's latest results show a 38.26% increase in net profit to ₹44.70 crores, but a concerning 9.09% decline in net sales and heavy reliance on non-operating income indicate ongoing operational challenges. Investors should exercise caution due to these structural issues.

Marathon Nextgen Realty Ltd's latest results present a mixed picture, highlighting both positive and negative aspects. On the positive side, the company reported a consolidated net profit of ₹44.70 crores for the quarter ended March 2026, which is a significant increase of 38.26% compared to the previous quarter. This rebound in profit is encouraging, especially after a challenging previous quarter.<BR><BR>However, the overall performance is marred by persistent operational challenges. Net sales fell to ₹113.55 crores, marking a decline of 9.09% quarter-on-quarter and a substantial 23.58% year-on-year. This drop in sales is concerning, as it reflects ongoing difficulties in project execution and demand within the real estate sector.<BR><BR>Additionally, the company's heavy reliance on other income, which constituted 61.20% of profit before tax, raises questions about the sustainability of its earnings. The operating margin, while slightly improved at 21.92%, is still down from the previous year, indicating challenges in maintaining profitability from core operations.<BR><BR>In summary, while the profit increase is a positive sign, the significant decline in sales and reliance on non-operating income suggest that the company's overall financial health is under pressure. Investors may need to approach with caution, considering the structural issues impacting the business.

View full answer

When is the next results date for Marathon Nextgen Realty Ltd?

11-Feb-2026

The next results date for Marathon Nextgen Realty Ltd is 13 February 2026.

The next results date for Marathon Nextgen Realty Ltd is scheduled for 13 February 2026.

View full answer

How has been the historical performance of Marathon Nextgen?

17-Nov-2025

Marathon Nextgen's historical performance shows fluctuating net sales, peaking at 716.53 Cr in Mar'23 and declining to 580.14 Cr by Mar'25, despite improvements in profitability metrics like profit before tax and earnings per share. However, the negative cash flow from operations in Mar'25 raises concerns about operational efficiency.

Answer:<BR>The historical performance of Marathon Nextgen shows a fluctuating trend in net sales and profitability over the years, with a notable decline in recent periods.<BR><BR>Breakdown:<BR>Marathon Nextgen's net sales peaked at 716.53 Cr in Mar'23 but fell to 580.14 Cr by Mar'25. The total operating income followed a similar trend, decreasing from 716.53 Cr in Mar'23 to 580.14 Cr in Mar'25. The company experienced a significant operating profit (PBDIT) of 269.32 Cr in Mar'25, slightly down from 274.07 Cr in Mar'24, but still higher than the 281.74 Cr recorded in Mar'23. Profit before tax increased to 207.89 Cr in Mar'25, up from 180.15 Cr in Mar'24, while profit after tax also rose to 162.47 Cr from 133.72 Cr in the previous year. The earnings per share (EPS) improved to 36.44 in Mar'25, compared to 32.53 in Mar'24. On the balance sheet, total assets decreased from 2,245.09 Cr in Mar'24 to 2,094.96 Cr in Mar'25, while total liabilities also declined from 2,245.09 Cr to 2,094.96 Cr during the same period. The cash flow from operating activities turned negative at -25.00 Cr in Mar'25, contrasting with a positive cash flow of 22.00 Cr in Mar'24. Overall, while the company has shown resilience in profitability, the decline in sales and operating cash flow raises concerns about its operational efficiency.

View full answer

Is Marathon Nextgen technically bullish or bearish?

14-Nov-2025

As of November 13, 2025, Marathon Nextgen's technical trend is mildly bearish, indicated by bearish MACD and KST readings on weekly and monthly charts, despite some short-term support from daily moving averages.

As of 13 November 2025, the technical trend for Marathon Nextgen has changed from sideways to mildly bearish. The current stance is mildly bearish, driven by weekly and monthly MACD readings indicating bearish momentum, along with a bearish signal from the KST on both time frames. The Bollinger Bands show a bearish trend on the weekly chart, while the daily moving averages are mildly bullish, suggesting some short-term support. The Dow Theory also reflects a mildly bearish outlook on the weekly basis. Overall, the combination of these indicators suggests a cautious approach, with bearish sentiment prevailing in the longer time frames.

View full answer

Who are the top shareholders of the Marathon Nextgen?

17-Jul-2025

The top shareholders of Marathon Nextgen include Marathon Realty Pvt Ltd with 51.15%, Quant Small Cap Fund at 9.49%, and various mutual funds holding 11.89%. Additionally, 19 foreign institutional investors own 9.9%, while individual investors account for 12.76% of the holdings, with no pledged promoter holdings.

The top shareholders of Marathon Nextgen include Marathon Realty Pvt Ltd, which holds the largest share at 51.15%. Other significant shareholders are the Quant Small Cap Fund with 9.49%, and various mutual funds that collectively hold 11.89% through four schemes. Additionally, 19 foreign institutional investors (FIIs) own 9.9% of the company, while individual investors account for 12.76% of the holdings. There are no pledged promoter holdings noted.

View full answer

Is Marathon Nextgen overvalued or undervalued?

09-Jun-2025

As of April 15, 2025, Marathon Nextgen is considered very expensive and overvalued with a PE ratio of 15.36, despite outperforming the Sensex with a 29.02% return over the past year, indicating that its current price level is not justified compared to peers like DLF and Macrotech Development.

As of 15 April 2025, the valuation grade for Marathon Nextgen has moved from expensive to very expensive, indicating a significant shift in its market perception. The company is currently considered overvalued. Key ratios include a PE ratio of 15.36, an EV to EBITDA of 20.01, and a ROE of 16.15%. <BR><BR>When compared to peers such as DLF, which has a PE ratio of 46.64, and Macrotech Development with a PE of 54.71, Marathon Nextgen's valuation appears less aggressive, yet it still falls into the very expensive category. Notably, the company's stock has outperformed the Sensex over various periods, including a 29.02% return over the past year compared to the Sensex's 7.58%. This performance may suggest investor optimism, but the current valuation metrics indicate that the stock is not justified at its current price level.

View full answer

What is the bonus history of the Marathon Nextgen?

06-Jun-2025

Marathon Nextgen has issued several bonuses, including a 1:2 bonus on December 21, 2015, a 1:2 bonus on July 6, 2010, a 2:1 bonus on October 12, 2007, and a 4:1 bonus on March 16, 2006, reflecting its strategy to enhance shareholder value.

Marathon Nextgen has a history of several bonus issues over the years. The most recent bonus was a 1:2 bonus issue announced with an ex-date of December 21, 2015, and a record date of December 22, 2015. Prior to that, the company issued bonuses on the following dates:<BR><BR>- On July 6, 2010, there was another 1:2 bonus issue, with a record date of July 7, 2010.<BR>- A 2:1 bonus issue occurred on October 12, 2007, with a record date of October 15, 2007.<BR>- The earliest recorded bonus was a 4:1 issue on March 16, 2006, with a record date of March 29, 2006.<BR><BR>This history reflects the company's strategy to enhance shareholder value through bonus shares.

View full answer

Has Marathon Nextgen declared dividend?

06-Jun-2025

Marathon Nextgen Realty Ltd has declared a 20% dividend, amounting to 1 per share, with an ex-date of September 17, 2024. Despite recent fluctuations, the company has shown significant total returns over various periods, particularly in the long term.

Marathon Nextgen Realty Ltd has declared a 20% dividend.<BR><BR>Dividend Details:<BR>- Percentage announced: 20%<BR>- Amount per share: 1 per share<BR>- Ex-date: 17 Sep 24<BR><BR>Dividend Yield: 0.19%.<BR><BR>Total Returns by Period:<BR>In the last 6 months, the price return was -12.76%, the dividend return was 0%, resulting in a total return of -12.76%.<BR><BR>Over the past year, the price return was 29.38%, with a dividend return of 0.22%, leading to a total return of 29.6%.<BR><BR>In the 2-year period, the price return was 69.02%, the dividend return was 0.61%, culminating in a total return of 69.63%.<BR><BR>For the 3-year period, the price return was 291.45%, the dividend return was 1.40%, resulting in a total return of 292.85%.<BR><BR>In the last 4 years, the price return was 724.5%, with a dividend return of 3.54%, leading to a total return of 728.04%.<BR><BR>Finally, over the past 5 years, the price return was 947.05%, the dividend return was 4.85%, resulting in a total return of 951.9%.<BR><BR>Overall, Marathon Nextgen Realty Ltd has declared a substantial dividend, and the total returns over various periods show significant growth, particularly in the longer term, indicating a strong performance despite some fluctuations in the short term.

View full answer
iScoreScore
Click here to find our call on this stock
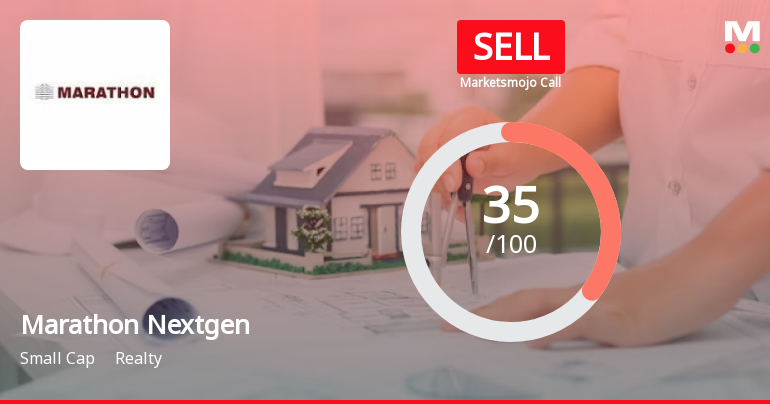
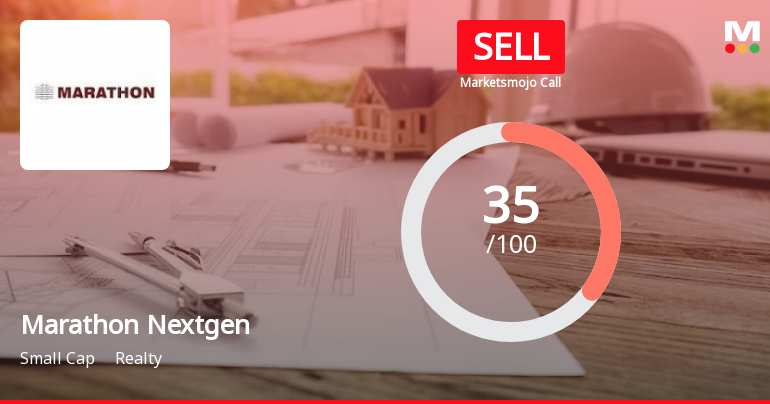
Strong Sell
Sell
Hold
Buy
Strong Buy

Dashboard

1

Flat results in Jun 26

  • ROCE(HY) Lowest at 11.11%
  • INVENTORY TURNOVER RATIO(HY) Lowest at 0.59 times
2

With ROE of 9, it has a Very Expensive valuation with a 1.2 Price to Book Value

3

Underperformed the market in the last 1 year

stock-summaryMojo Parameters

Mojo Parameters

Loading Valuation Snapshot...

Stock DNA

stock-summary
Industry

Realty

stock-summary
Market cap

INR 2,806 Cr (Small Cap)

stock-summary
P/E

14.00

stock-summary
Industry P/E

34

stock-summary
Dividend Yield

0.24%

stock-summary
Debt Equity

-0.13

stock-summary
Return on Equity

8.99%

stock-summary
Price to Book

1.23

Revenue and Profits:
Net Sales:
198 Cr
(Quarterly Results - Jun 2026)
Net Profit:
50 Cr
stock-summaryTotal Returns
Total Returns (Price + Dividend) stock-summary
Dividend Yield (0.24%)
TimePeriod
Price Return
Dividend Return
Total Return
3 Months
1.21%
0.25%
1.46%
6 Months
-3.48%
0.25%
-3.23%
1 Year
-35.72%
0.16%
-35.56%
2 Years
-37.24%
0.29%
-36.95%
3 Years
-9.07%
0.70%
-8.37%
4 Years
62.43%
1.87%
64.3%
5 Years
384.01%
4.65%
388.66%

Latest dividend: 1 per share ex-dividend date: Sep-18-2026

Risk Adjusted Returns v/s stock-summary
Returns Beta
Icon
Beta has not been calculated since enough price history is not available
stock-summaryNews & Corporate Actions

News

Marathon Nextgen Realty Ltd Gains 19.17%: 2 Key Events Driving the Surge

Announcements stock-summary

Announcement under Regulation 30 (LODR)-Analyst / Investor Meet - Intimation

11-Sep-2026 | Source : BSE

Please find attached Intimation of Analyst / Investor meet

Disclosure Of Voting Results And Consolidated Scrutinizers Report Pursuant To Regulation 44(3) Read With Regulation 30 Of The SEBI (Listing Obligations And Disclosure Requirements) Regulations 2015

08-Sep-2026 | Source : BSE

Please find attached Voting Results and Scrutinizers Report

Shareholder Meeting / Postal Ballot-Scrutinizer"s Report

08-Sep-2026 | Source : BSE

Please find attached the voting results and the scrutinizers report.

Corporate Actions stock-summary

stock-summary
BOARD MEETING

No Upcoming Board Meetings

stock-summary
DIVIDEND

Marathon Nextgen Realty Ltd has declared 20% dividend, ex-date: 18 Sep 26

stock-summary
SPLITS

Marathon Nextgen Realty Ltd has announced 5:10 stock split, ex-date: 05 Apr 18

stock-summary
BONUS

Marathon Nextgen Realty Ltd has announced 1:2 bonus issue, ex-date: 21 Dec 15

stock-summary
RIGHTS

No Rights history available

stock-summaryKey Factors

Quality key factors stock-summary

Factor
Value
Sales Growth (5y)
24.85%
EBIT Growth (5y)
23.49%
EBIT to Interest (avg)
10.56
Debt to EBITDA (avg)
5.49
Net Debt to Equity (avg)
-0.13
Sales to Capital Employed (avg)
0.31
Tax Ratio
24.05%
Dividend Payout Ratio
2.75%
Pledged Shares
0
Institutional Holding
19.38%
ROCE (avg)
9.85%
ROE (avg)
12.52%

Valuation key factors

Factor
Value
P/E Ratio
14
Industry P/E
34
Price to Book Value
1.20
EV to EBIT
17.72
EV to EBITDA
17.52
EV to Capital Employed
1.23
EV to Sales
4.39
PEG Ratio
NA
Dividend Yield
0.49%
ROCE (Latest)
6.16%
ROE (Latest)
8.99%

Technicals key factors

Indicator
Weekly
Monthly
MACD
Mildly Bullish
Bearish
RSI
No Signal
No Signal
Bollinger Bands
Bearish
Bearish
Moving Averages
Mildly Bearish (Daily)
KST
Mildly Bullish
Bearish
Dow Theory
Mildly Bullish
Mildly Bullish
OBV
Bullish
Bullish
stock-summary Technical Indicator Scale: Bearish, Mildly Bearish, Sideways, Mildly Bullish, Bullish  Turned 
stock-summaryShareholding
Shareholding Snapshot : Jun 2026stock-summary
Shareholding Compare (%holding) stock-summary
Majority shareholders

Promoters

Pledged Promoter Holdings

None

Mutual Funds

Held by 2 Schemes (9.94%)

FIIs

Held by 22 FIIs (4.68%)

Promoter with highest holding

Marathon Realty Pvt Ltd (51.15%)

Highest Public shareholder

Quant Mutual Fund - Quant Small Cap Fund (9.94%)

Individual Investors Holdings

15.23%

stock-summaryFinancial
[
  {
    "link": "quarterly",
    "btn_text": "All Quarterly Results",
    "header": "Quarterly Results Snapshot (Consolidated) - Jun'26 - QoQ",
    "rhs": [
      {
        "prefix": "Net Sales ",
        "suffix": "QoQ Growth in quarter ended Jun 2026 is 73.93% vs -9.09% in Mar 2026",
        "dir": 1
      },
      {
        "prefix": "Consolidated Net Profit ",
        "suffix": "QoQ Growth in quarter ended Jun 2026 is 12.37% vs 38.26% in Mar 2026",
        "dir": -1
      }
    ],
    "table": {
      "header": [
        "Jun'26",
        "Mar'26",
        "Change(%)"
      ],
      "body": [
        {
          "field": "Net Sales",
          "val1": "197.50",
          "val2": "113.55",
          "chgp": "73.93%",
          "chgp_class": "positive"
        },
        {
          "field": "Operating Profit (PBDIT) excl Other Income",
          "val1": "46.52",
          "val2": "24.89",
          "chgp": "86.90%",
          "chgp_class": "positive"
        },
        {
          "field": "Interest",
          "val1": "0.69",
          "val2": "0.26",
          "chgp": "165.38%",
          "chgp_class": "negative"
        },
        {
          "field": "Exceptional Items",
          "val1": "0.00",
          "val2": "0.00",
          "chgp": "",
          "chgp_class": "neutral"
        },
        {
          "field": "Consolidate Net Profit",
          "val1": "50.23",
          "val2": "44.70",
          "chgp": "12.37%",
          "chgp_class": "positive"
        },
        {
          "field": "Operating Profit Margin (Excl OI)",
          "val1": "23.55%",
          "val2": "21.92%",
          "chgp": "1.63%",
          "chgp_class": "positive"
        }
      ]
    }
  },
  {
    "link": "half-yearly",
    "btn_text": "All Half Yearly Results",
    "header": "Half Yearly Results Snapshot (Consolidated) - Sep'25",
    "rhs": [
      {
        "prefix": "Net Sales ",
        "suffix": " Growth in half year ended Sep 2025 is -16.40% vs -9.03% in Sep 2024",
        "dir": -1
      },
      {
        "prefix": "Consolidated Net Profit ",
        "suffix": " Growth in half year ended Sep 2025 is 47.51% vs 11.58% in Sep 2024",
        "dir": 1
      }
    ],
    "table": {
      "header": [
        "Sep'25",
        "Sep'24",
        "Change(%)"
      ],
      "body": [
        {
          "field": "Net Sales",
          "val1": "257.67",
          "val2": "308.20",
          "chgp": "-16.40%",
          "chgp_class": "negative"
        },
        {
          "field": "Operating Profit (PBDIT) excl Other Income",
          "val1": "72.93",
          "val2": "95.36",
          "chgp": "-23.52%",
          "chgp_class": "negative"
        },
        {
          "field": "Interest",
          "val1": "14.18",
          "val2": "31.89",
          "chgp": "-55.53%",
          "chgp_class": "positive"
        },
        {
          "field": "Exceptional Items",
          "val1": "0.00",
          "val2": "0.00",
          "chgp": "",
          "chgp_class": "neutral"
        },
        {
          "field": "Consolidate Net Profit",
          "val1": "125.93",
          "val2": "85.37",
          "chgp": "47.51%",
          "chgp_class": "positive"
        },
        {
          "field": "Operating Profit Margin (Excl OI)",
          "val1": "28.30%",
          "val2": "30.94%",
          "chgp": "-2.64%",
          "chgp_class": "negative"
        }
      ]
    }
  },
  {
    "link": "nine-monthly",
    "btn_text": "All Nine Monthly Results",
    "header": "Nine Monthly Results Snapshot (Consolidated) - Dec'25",
    "rhs": [
      {
        "prefix": "Net Sales ",
        "suffix": "YoY Growth in nine months ended Dec 2025 is -11.35% vs -21.42% in Dec 2024",
        "dir": 1
      },
      {
        "prefix": "Consolidated Net Profit ",
        "suffix": "YoY Growth in nine months ended Dec 2025 is 18.76% vs 5.22% in Dec 2024",
        "dir": 1
      }
    ],
    "table": {
      "header": [
        "Dec'25",
        "Dec'24",
        "Change(%)"
      ],
      "body": [
        {
          "field": "Net Sales",
          "val1": "382.57",
          "val2": "431.55",
          "chgp": "-11.35%",
          "chgp_class": "negative"
        },
        {
          "field": "Operating Profit (PBDIT) excl Other Income",
          "val1": "97.97",
          "val2": "131.77",
          "chgp": "-25.65%",
          "chgp_class": "negative"
        },
        {
          "field": "Interest",
          "val1": "14.27",
          "val2": "40.57",
          "chgp": "-64.83%",
          "chgp_class": "positive"
        },
        {
          "field": "Exceptional Items",
          "val1": "-2.27",
          "val2": "0.00",
          "chgp": "",
          "chgp_class": "neutral"
        },
        {
          "field": "Consolidate Net Profit",
          "val1": "158.26",
          "val2": "133.26",
          "chgp": "18.76%",
          "chgp_class": "positive"
        },
        {
          "field": "Operating Profit Margin (Excl OI)",
          "val1": "25.61%",
          "val2": "30.53%",
          "chgp": "-4.92%",
          "chgp_class": "negative"
        }
      ]
    }
  },
  {
    "link": "annual",
    "btn_text": "All Annual Results",
    "header": "Annual Results Snapshot (Consolidated) - Mar'26",
    "rhs": [
      {
        "prefix": "Net Sales ",
        "suffix": "YoY Growth in year ended Mar 2026 is -14.48% vs -17.67% in Mar 2025",
        "dir": 1
      },
      {
        "prefix": "Consolidated Net Profit ",
        "suffix": "YoY Growth in year ended Mar 2026 is 8.80% vs 12.06% in Mar 2025",
        "dir": -1
      }
    ],
    "table": {
      "header": [
        "Mar'26",
        "Mar'25",
        "Change(%)"
      ],
      "body": [
        {
          "field": "Net Sales",
          "val1": "496.12",
          "val2": "580.14",
          "chgp": "-14.48%",
          "chgp_class": "negative"
        },
        {
          "field": "Operating Profit (PBDIT) excl Other Income",
          "val1": "121.09",
          "val2": "173.05",
          "chgp": "-30.03%",
          "chgp_class": "negative"
        },
        {
          "field": "Interest",
          "val1": "12.76",
          "val2": "58.77",
          "chgp": "-78.29%",
          "chgp_class": "positive"
        },
        {
          "field": "Exceptional Items",
          "val1": "-2.27",
          "val2": "0.00",
          "chgp": "",
          "chgp_class": "neutral"
        },
        {
          "field": "Consolidate Net Profit",
          "val1": "202.96",
          "val2": "186.55",
          "chgp": "8.80%",
          "chgp_class": "positive"
        },
        {
          "field": "Operating Profit Margin (Excl OI)",
          "val1": "24.41%",
          "val2": "29.83%",
          "chgp": "-5.42%",
          "chgp_class": "negative"
        }
      ]
    }
  }
]

Quarterly Results Snapshot (Consolidated) - Jun'26 - QoQstock-summary

Jun'26
Mar'26
Change(%)
Net Sales
197.50
113.55
73.93%
Operating Profit (PBDIT) excl Other Income
46.52
24.89
86.90%
Interest
0.69
0.26
165.38%
Exceptional Items
0.00
0.00
Consolidate Net Profit
50.23
44.70
12.37%
Operating Profit Margin (Excl OI)
23.55%
21.92%
1.63%
Values in Rs Cr.
Direction Arrows
Net Sales

QoQ Growth in quarter ended Jun 2026 is 73.93% vs -9.09% in Mar 2026

Direction Arrows
Consolidated Net Profit

QoQ Growth in quarter ended Jun 2026 is 12.37% vs 38.26% in Mar 2026

Half Yearly Results Snapshot (Consolidated) - Sep'25stock-summary

Sep'25
Sep'24
Change(%)
Net Sales
257.67
308.20
-16.40%
Operating Profit (PBDIT) excl Other Income
72.93
95.36
-23.52%
Interest
14.18
31.89
-55.53%
Exceptional Items
0.00
0.00
Consolidate Net Profit
125.93
85.37
47.51%
Operating Profit Margin (Excl OI)
28.30%
30.94%
-2.64%
Values in Rs Cr.
Direction Arrows
Net Sales

Growth in half year ended Sep 2025 is -16.40% vs -9.03% in Sep 2024

Direction Arrows
Consolidated Net Profit

Growth in half year ended Sep 2025 is 47.51% vs 11.58% in Sep 2024

Nine Monthly Results Snapshot (Consolidated) - Dec'25stock-summary

Dec'25
Dec'24
Change(%)
Net Sales
382.57
431.55
-11.35%
Operating Profit (PBDIT) excl Other Income
97.97
131.77
-25.65%
Interest
14.27
40.57
-64.83%
Exceptional Items
-2.27
0.00
Consolidate Net Profit
158.26
133.26
18.76%
Operating Profit Margin (Excl OI)
25.61%
30.53%
-4.92%
Values in Rs Cr.
Direction Arrows
Net Sales

YoY Growth in nine months ended Dec 2025 is -11.35% vs -21.42% in Dec 2024

Direction Arrows
Consolidated Net Profit

YoY Growth in nine months ended Dec 2025 is 18.76% vs 5.22% in Dec 2024

Annual Results Snapshot (Consolidated) - Mar'26stock-summary

Mar'26
Mar'25
Change(%)
Net Sales
496.12
580.14
-14.48%
Operating Profit (PBDIT) excl Other Income
121.09
173.05
-30.03%
Interest
12.76
58.77
-78.29%
Exceptional Items
-2.27
0.00
Consolidate Net Profit
202.96
186.55
8.80%
Operating Profit Margin (Excl OI)
24.41%
29.83%
-5.42%
Values in Rs Cr.
Direction Arrows
Net Sales

YoY Growth in year ended Mar 2026 is -14.48% vs -17.67% in Mar 2025

Direction Arrows
Consolidated Net Profit

YoY Growth in year ended Mar 2026 is 8.80% vs 12.06% in Mar 2025

stock-summaryCompany CV
About Marathon Nextgen Realty Ltd stock-summary
stock-summary
Marathon Nextgen Realty Ltd
Small Cap
Realty
Marathon Nextgen Realty Limited was erstwhile incorporated as Piramal Spinning & Weaving Mills Limited on January 13, 1978. Thereafter, the Company changed the name to "Marathon Nextgen Realty and Textiles Limited" on July 31, 2003 and further was changed from Marathon Nextgen Realty and Textiles Limited to Marathon Nextgen Realty Limited effective on September 7, 2007. In June, 1979, Company got amalgamated with Mahadevi Invesment Company.
Company Coordinates stock-summary
Company Details
Futurex N M Joshi Marg, Nr Railway Station Lower Parel Mumbai Maharashtra : 400013
stock-summary
Tel: 91-22-672488585/61588484
stock-summary
shares@marathonnextgen.com
Registrar Details
Adroit Corporate Services Pvt Ltd, 17-20 Jaferbhoy Industrial Estate , 1st Floor, Makwana Road, Marol Naka, Mumbai