
 Price Point
Compare EFC (I) with Similar Stocks


 Total Returns
Total Returns (Price + Dividend) 
EFC (I) for the last several years.
Risk Adjusted Returns v/s
Returns Beta
 News & Corporate Actions
News
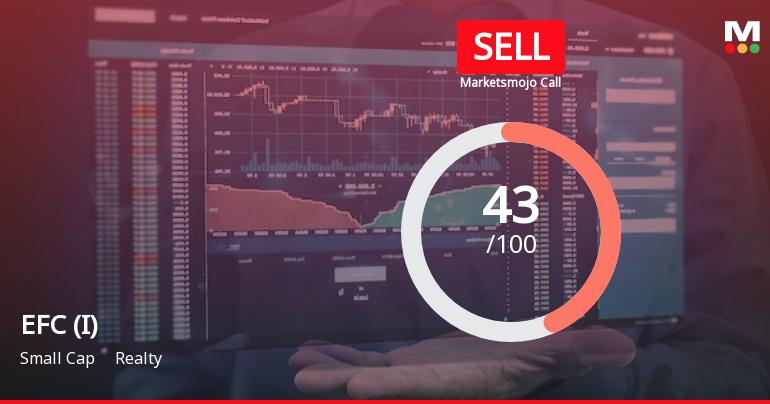
EFC (I) Ltd is Rated Sell by MarketsMOJO
EFC (I) Ltd is rated 'Sell' by MarketsMOJO, with this rating last updated on 29 May 2026. However, the analysis and financial metrics discussed here reflect the stock's current position as of 16 September 2026, providing investors with an up-to-date view of the company’s fundamentals, valuation, financial trend, and technical outlook.
Read full news article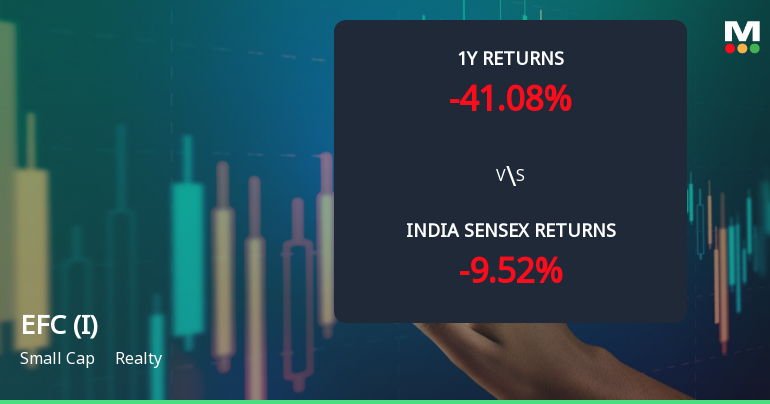
EFC (I) Ltd Technical Momentum Shifts Amid Bearish Outlook
EFC (I) Ltd, a small-cap player in the Realty sector, has experienced a notable shift in its technical momentum, with key indicators signalling a transition from mildly bearish to bearish trends. Despite some mildly bullish signals on weekly MACD and KST, the overall technical landscape remains challenging, reflecting the stock’s underperformance relative to the broader market benchmarks.
Read full news article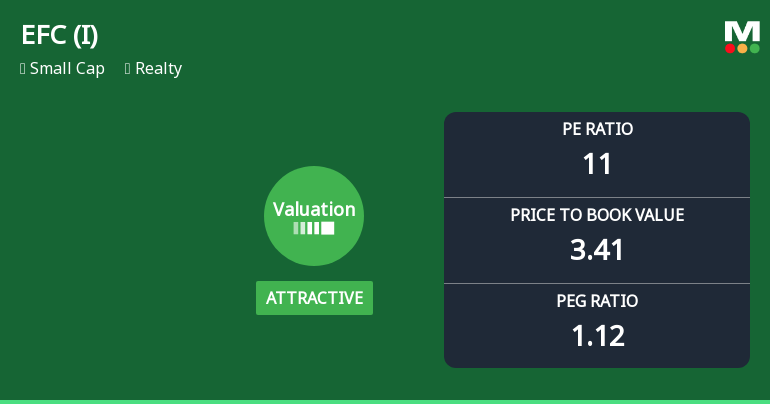
EFC (I) Ltd Valuation Shifts Signal Renewed Price Attractiveness Amid Market Challenges
EFC (I) Ltd, a small-cap player in the realty sector, has witnessed a notable shift in its valuation parameters, moving from a fair to an attractive valuation grade. Despite recent price declines and sector headwinds, the company’s price-to-earnings (P/E) and price-to-book value (P/BV) ratios now present a compelling case for investors seeking value in a challenging market environment.
Read full news article Announcements
Announcement under Regulation 30 (LODR)-Analyst / Investor Meet - Intimation
17-Sep-2026 | Source : BSEAs per attached letter
Announcement under Regulation 30 (LODR)-Newspaper Publication
09-Sep-2026 | Source : BSEEFC (I) Limited has informed the Exchange about Copy of Newspaper Publication for Notice of the 42nd Annual General Meeting scheduled to be held on September 30 2026.
Notice Of 42Nd Annual General Meeting Scheduled On September 30 2026.
08-Sep-2026 | Source : BSEThe Notice of 42nd Annual General Meeting scheduled on September 30 2026 is attached herewith.
Corporate Actions

No Upcoming Board Meetings

No Dividend history available

EFC (I) Ltd has announced 2:10 stock split, ex-date: 18 Aug 23

EFC (I) Ltd has announced 1:1 bonus issue, ex-date: 11 Feb 25

EFC (I) Ltd has announced 8:103 rights issue, ex-date: 07 May 26
Key FactorsQuality key factors
Valuation key factors
Technicals key factors
 Technical Indicator Scale: Bearish, Mildly Bearish, Sideways, Mildly Bullish, Bullish Turned Shareholding
Shareholding Snapshot : Jun 2026
Shareholding Compare (%holding)
Promoters
None
Held by 1 Schemes (2.95%)
Held by 25 FIIs (1.26%)
Umesh Kumar Sahay (35.95%)
Bandhan Small Cap Fund (2.95%)
18.29%
FinancialQuarterly Results Snapshot (Consolidated) - Jun'26 - QoQ
 Compare with Peers
QoQ Growth in quarter ended Jun 2026 is -3.41% vs 8.64% in Mar 2026
QoQ Growth in quarter ended Jun 2026 is -0.58% vs 9.74% in Mar 2026

Half Yearly Results Snapshot (Consolidated) - Sep'25

Growth in half year ended Sep 2025 is 76.62% vs 74.14% in Sep 2024
Growth in half year ended Sep 2025 is 79.35% vs 226.20% in Sep 2024
Nine Monthly Results Snapshot (Consolidated) - Dec'25
YoY Growth in nine months ended Dec 2025 is 66.87% vs 36.62% in Dec 2024
YoY Growth in nine months ended Dec 2025 is 61.28% vs 193.68% in Dec 2024
Annual Results Snapshot (Consolidated) - Mar'26
YoY Growth in year ended Mar 2026 is 57.85% vs 60.06% in Mar 2025
YoY Growth in year ended Mar 2026 is 62.94% vs 145.06% in Mar 2025
 Company CV
About EFC (I) Ltd

Company Coordinates










