
Compare Markolines Pavem with Similar Stocks
Total Returns (Price + Dividend) 
Latest dividend: 1.5 per share ex-dividend date: Sep-19-2025
Risk Adjusted Returns v/s
Returns Beta

News

Markolines Pavement Technologies Ltd is Rated Hold
Markolines Pavement Technologies Ltd is rated 'Hold' by MarketsMOJO, with this rating last updated on 17 June 2026. However, the analysis and financial metrics discussed here reflect the stock's current position as of 10 July 2026, providing investors with an up-to-date view of the company’s performance and outlook.
Read full news article
Broad-Based Technical Strength Lifts Markolines Pavement Technologies Ltd to 52-Week High of Rs 190.5
Markolines Pavement Technologies Ltd has surged to a fresh 52-week high of Rs 190.5 on 3 Jul 2026, propelled by a sustained 11-day winning streak that has delivered a 15% gain in that period. This rally stands out amid a declining Capital Goods sector and a broadly positive Sensex, underscoring the stock's strong price momentum and technical alignment.
Read full news article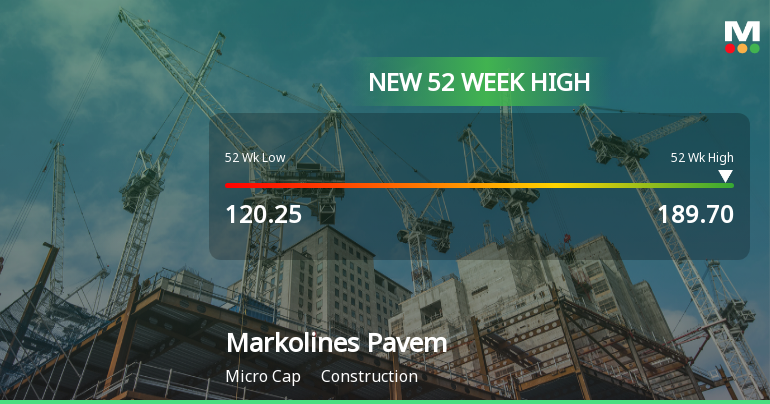
Broad-Based Technical Strength Lifts Markolines Pavement Technologies Ltd to 52-Week High of Rs 189.7
Markolines Pavement Technologies Ltd has surged to a fresh 52-week high of Rs 189.7 on 2 Jul 2026, marking a significant milestone after a sustained rally that has seen the stock appreciate 20.42% over the past year, comfortably outperforming the Sensex which declined 7.40% in the same period.
Read full news article Announcements
Intimation Regarding Receipt Of Listing And Trading Approval For 162800 Equity Shares From BSE Limited And National Stock Exchange Of India Limited
17-Jul-2026 | Source : BSEIt is informed to the esteemed exchange that the Company has received listing and trading approval from BSE Limited and National Stock Exchange of India Limited for 162800 Equity Shares of face value of Rs. 10 each allotted on Preferential Basis. Copy of the approval letters from BSE and NSE are attached herewith.
Compliances-Certificate under Reg. 74 (5) of SEBI (DP) Regulations 2018
09-Jul-2026 | Source : BSEMarkolines Pavement Technologies Limited informed the esteemed exchange about the certificate received from its RTA under Regulation 74 (5) of SEBI (DP) Regulations for June 2026 quarter.
Intimation Regarding Strategic Expansion Into Marine Infrastructure Construction And Maintenance Activities
03-Jul-2026 | Source : BSEMarkolines Pavement Technologies Limited informed the esteemed exchange about Companys intent to explore opportunities in the Marine Infrastructure Construction and Maintenance Segment.
Corporate Actions

No Upcoming Board Meetings

Markolines Pavement Technologies Ltd has declared 15% dividend, ex-date: 19 Sep 25

No Splits history available

No Bonus history available

Markolines Pavement Technologies Ltd has announced 5:32 rights issue, ex-date: 17 Jan 23
Quality key factors
Valuation key factors
Technicals key factors
 Technical Indicator Scale: Bearish, Mildly Bearish, Sideways, Mildly Bullish, Bullish Turned
 Shareholding Snapshot : Jun 2026
Shareholding Compare (%holding)
Promoters
None
Held by 0 Schemes
Held by 3 FIIs (0.59%)
Sanjay B Patil (26.02%)
Hi Klass Trading & Investment Limited (3.09%)
29.63%
Quarterly Results Snapshot (Standalone) - Mar'26 - QoQ

QoQ Growth in quarter ended Mar 2026 is 15.25% vs 3.59% in Dec 2025

QoQ Growth in quarter ended Mar 2026 is 60.23% vs 77.69% in Dec 2025
Half Yearly Results Snapshot (Consolidated) - Sep'25
Growth in half year ended Sep 2025 is -25.39% vs 90.42% in Mar 2025
Growth in half year ended Sep 2025 is -56.59% vs 337.92% in Mar 2025
Nine Monthly Results Snapshot (Consolidated) - Dec'25
YoY Growth in nine months ended Dec 2025 is 30.88% vs -21.28% in Dec 2024
YoY Growth in nine months ended Dec 2025 is 42.57% vs -40.23% in Dec 2024
Annual Results Snapshot (Consolidated) - Mar'26
YoY Growth in year ended Mar 2026 is 13.36% vs -11.48% in Mar 2025
YoY Growth in year ended Mar 2026 is 16.27% vs 30.40% in Mar 2025
About Markolines Pavement Technologies Ltd

Company Coordinates


