
Compare Maruti Global In with Similar Stocks
Stock DNA
Non Banking Financial Company (NBFC)
INR 19 Cr (Micro Cap)
26.00
21
0.00%
-1.11
-3.44%
-0.95
Total Returns (Price + Dividend) 
Maruti Global In for the last several years.
Risk Adjusted Returns v/s
Returns Beta

News
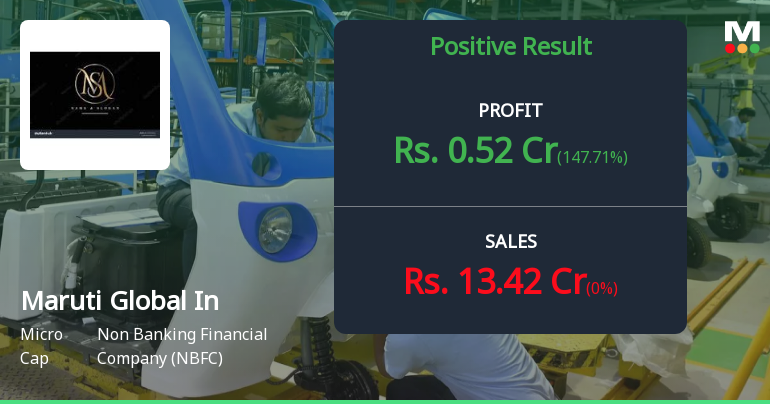
Maruti Global Industries Q4 FY26: Dramatic Turnaround Masks Underlying Fragility
Maruti Global Industries Ltd., a micro-cap non-banking financial company with a market capitalisation of ₹21.00 crores, posted a net profit of ₹0.52 crores in Q4 FY26 (Mar'26), marking a dramatic reversal from a loss of ₹1.09 crores in the corresponding quarter last year. However, the stock has remained under pressure, declining 2.38% in the immediate trading session following the results announcement, reflecting deep-seated investor concerns about the company's negative book value and volatile operating history.
Read full news article Announcements
Announcement under Regulation 30 (LODR)-Award_of_Order_Receipt_of_Order
25-Jul-2026 | Source : BSECompany received work order from MSN Life Sciences Private Limited approx of 5.9 Crores towards construction of structural works retaining walls fabrications & others etc. please find the enclosed attachment to this intimation.
Announcement under Regulation 30 (LODR)-Award_of_Order_Receipt_of_Order
25-Jul-2026 | Source : BSECompany received order from MSN Laboratories Private Limited of 5.9 Crores towards constructions of civil work retaining walls fabrication and others etc. please find the enclosed detailed intimation as per the SEBI-LODR
Disclosure Received Under Regulation 29(2) Of The SEBI (SAST) Regulations 2011 With Respect 2076 Equity Shares Acquired By Promoter
24-Jun-2026 | Source : BSECompany received disclosure u/reg. 29(2) from the promoter of Mr. Rama Swamy Reddy Pedinekaluva with respect to 2076 equity shares acquisition.
Corporate Actions

No Upcoming Board Meetings

No Dividend history available

No Splits history available

No Bonus history available

No Rights history available
Quality key factors
Valuation key factors
Technicals key factors
 Technical Indicator Scale: Bearish, Mildly Bearish, Sideways, Mildly Bullish, Bullish Turned
 Shareholding Snapshot : Mar 2026
Shareholding Compare (%holding)
Promoters
None
Held by 0 Schemes
Held by 0 FIIs
Rama Swamy Reddy Pedinekaluva (59.57%)
Mohana Rao Vadlamudi (12.7%)
38.33%
Quarterly Results Snapshot (Standalone) - Mar'26 - YoY
YoY Growth in quarter ended Mar 2026 is 0.00% vs 0.00% in Mar 2025

YoY Growth in quarter ended Mar 2026 is 147.71% vs -2,080.00% in Mar 2025
Half Yearly Results Snapshot (Standalone) - Sep'25
Growth in half year ended Sep 2025 is 0.00% vs 0.00% in Sep 2024
Growth in half year ended Sep 2025 is 258.33% vs 7.69% in Sep 2024
Nine Monthly Results Snapshot (Standalone) - Dec'25
YoY Growth in nine months ended Dec 2025 is 0.00% vs 0.00% in Dec 2024

YoY Growth in nine months ended Dec 2025 is -98.51% vs 7,933.33% in Dec 2024
Annual Results Snapshot (Standalone) - Mar'26
YoY Growth in year ended Mar 2026 is 0.00% vs 0.00% in Mar 2025
YoY Growth in year ended Mar 2026 is -94.47% vs 5,520.83% in Mar 2025
About Maruti Global Industries Ltd

Company Coordinates


