
Compare TCI Finance with Similar Stocks
Stock DNA
Non Banking Financial Company (NBFC)
INR 24 Cr (Micro Cap)
6.00
21
0.00%
0.00
-5.19%
-0.32
Total Returns (Price + Dividend) 
TCI Finance for the last several years.
Risk Adjusted Returns v/s
Returns Beta

News
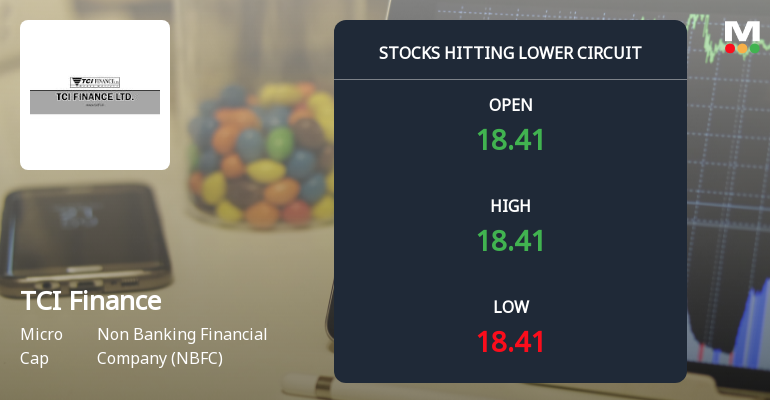
Below All Moving Averages and Now at Lower Circuit: TCI Finance Ltd Loses 4.97% in a Single Session
At Rs 18.53, sellers were still queuing — but there were no buyers willing to take the other side. TCI Finance Ltd locked at its lower circuit of 4.97% on 25 Jun 2026, with unfilled sell orders and a frozen price, reflecting persistent selling pressure in a micro-cap stock with limited liquidity.
Read full news article
TCI Finance Ltd Locks at Lower Circuit With 4.97% Loss — Sellers Queue, No Buyers in Sight
At Rs 19.5, sellers were still queuing — but there were no buyers willing to take the other side. TCI Finance Ltd locked at its lower circuit of 4.97% on 24 Jun 2026, with unfilled sell orders and a frozen price, reflecting persistent selling pressure in a micro-cap stock with limited liquidity.
Read full news article
TCI Finance Ltd Locks at Lower Circuit With 5.0% Loss — Sellers Queue, No Buyers in Sight
At Rs 20.52, sellers were still queuing — but there were no buyers willing to take the other side. TCI Finance Ltd locked at its lower circuit of 5.0% on 23 Jun 2026, with unfilled sell orders and a frozen price.
Read full news article Announcements
Clarification W.R.T Movement In Price
10-Jun-2026 | Source : BSEClarification w.r.t movement in price
Clarification sought from TCI Finance Ltd
09-Jun-2026 | Source : BSEThe Exchange has sought clarification from TCI Finance Ltd on June 9 2026 with reference to significant movement in price in order to ensure that investors have latest relevant information about the company and to inform the market so that the interest of the investors is safeguarded.
The reply is awaited.
Compliances-Reg.24(A)-Annual Secretarial Compliance
29-May-2026 | Source : BSEAnnual Secretarial Compliance Report for the year ended 31st March 2026
Corporate Actions

No Upcoming Board Meetings

No Dividend history available

No Splits history available

No Bonus history available

No Rights history available
Quality key factors
Valuation key factors
Technicals key factors
 Technical Indicator Scale: Bearish, Mildly Bearish, Sideways, Mildly Bullish, Bullish Turned
 Shareholding Snapshot : Mar 2026
Shareholding Compare (%holding)
Non Institution
None
Held by 0 Schemes
Held by 0 FIIs
Giri Roadlines And Commercial Trading Pvt. Ltd. (9.47%)
None
62.98%
Quarterly Results Snapshot (Standalone) - Mar'26 - QoQ
QoQ Growth in quarter ended Mar 2026 is 0.00% vs 0.00% in Dec 2025

QoQ Growth in quarter ended Mar 2026 is 110.09% vs -186.84% in Dec 2025
Half Yearly Results Snapshot (Standalone) - Sep'25
Growth in half year ended Sep 2025 is 0.00% vs -100.00% in Sep 2024
Growth in half year ended Sep 2025 is -12.68% vs -173.08% in Sep 2024
Nine Monthly Results Snapshot (Standalone) - Dec'25
YoY Growth in nine months ended Dec 2025 is 0.00% vs -100.00% in Dec 2024
YoY Growth in nine months ended Dec 2025 is -98.95% vs -9,600.00% in Dec 2024
Annual Results Snapshot (Standalone) - Mar'26
YoY Growth in year ended Mar 2026 is 0.00% vs -100.00% in Mar 2025

YoY Growth in year ended Mar 2026 is -149.72% vs 845.83% in Mar 2025
About TCI Finance Ltd

Company Coordinates


