
Compare Maruti Sec. with Similar Stocks
Stock DNA
Non Banking Financial Company (NBFC)
INR 20 Cr (Micro Cap)
2.00
9
0.00%
-1.06
-60.62%
-0.95
Total Returns (Price + Dividend) 
Maruti Sec. for the last several years.
Risk Adjusted Returns v/s
Returns Beta

News
Are Maruti Securities Ltd latest results good or bad?
Maruti Securities Ltd's latest financial results reveal a complex picture characterized by significant operational volatility and underlying financial challenges. In Q2 FY26, the company reported net sales of ₹3.32 crores, reflecting a substantial quarter-on-quarter growth of 315.00% from ₹0.80 crores in Q1 FY26. Concurrently, net profit rose to ₹0.13 crores, more than doubling from ₹0.06 crores in the previous quarter, indicating a modest recovery from a very low base. However, the company's performance is overshadowed by deeper structural issues. The PAT margin decreased to 3.92% from 7.50% in the prior quarter, suggesting difficulties in maintaining profitability despite higher revenues. Additionally, the book value per share remains negative at -₹43.30, and the company has reported negative shareholder equity of ₹21.65 crores, raising concerns about its long-term viability. The quarterly trend illustr...
Read full news article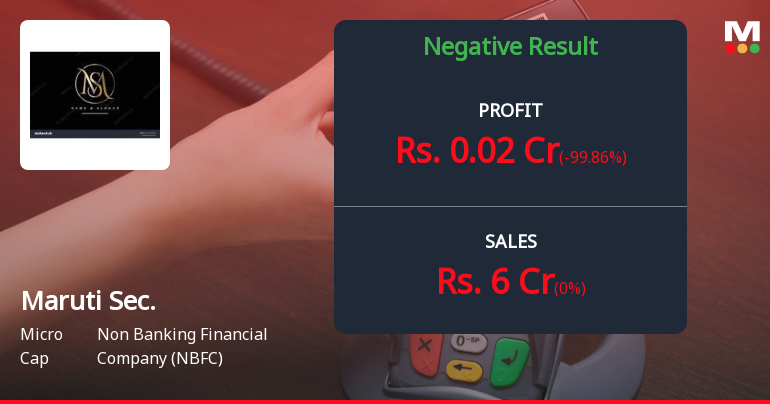
Maruti Securities Q2 FY26: Micro-Cap NBFC Posts Modest Profit Amid Structural Challenges
Maruti Securities Ltd., a Hyderabad-based micro-cap non-banking financial company, reported a net profit of ₹0.13 crores for Q2 FY26 (Jul-Sep'25), marking a sequential improvement from ₹0.06 crores in Q1 FY26 but remaining negligible in absolute terms. With a market capitalisation of just ₹23.00 crores and a current price of ₹50.00, the stock surged 7.85% following the results announcement, though it continues to trade 43.19% below its 52-week high of ₹88.02.
Read full news article Announcements
Unaudited Financial Results Of The Company For The Quarter And Nine Months Ended December 31 2025
11-Feb-2026 | Source : BSEUnaudited Financial Results of the Company for the Quarter and Nine Months Ended December 31 2025.
Board Meeting Outcome for Board Meeting Outcome For To Announce The Unaudited Financial Results Of The Company For The Quarter And Nine Months Ended December 31 2025
11-Feb-2026 | Source : BSEIn the held Board Meeting Directors of the Company adopted the Unaudited Financial Results of the Company for the Quarter and Nine Months Ended December 31 2025 along with the limited review report of the Statutory Auditors of the Company. Other Business Matters
Board Meeting Intimation for The Purpose Of Adoption Of Unaudited Financial Results Of The Company As On December 31 2025
03-Feb-2026 | Source : BSEMaruti Securities Ltdhas informed BSE that the meeting of the Board of Directors of the Company is scheduled on 11/02/2026 inter alia to consider and approve 1. To consider and adopt the unaudited financial results of the company for the quarter and nine months ended December 31 2025 along with the limited review report of the statutory auditors of the Company; 2. Other Business Matters.
Corporate Actions

No Upcoming Board Meetings

No Dividend history available

No Splits history available

No Bonus history available

No Rights history available
Quality key factors
Valuation key factors
Technicals key factors
 Technical Indicator Scale: Bearish, Mildly Bearish, Sideways, Mildly Bullish, Bullish Turned
 Shareholding Snapshot : Dec 2025
Shareholding Compare (%holding)
Promoters
None
Held by 0 Schemes
Held by 0 FIIs
Rama Swamy Reddy Pedinekaluva (59.57%)
Mohana Rao Vadlamudi (12.7%)
38.07%
Quarterly Results Snapshot (Standalone) - Dec'25 - YoY
YoY Growth in quarter ended Dec 2025 is 0.00% vs 0.00% in Dec 2024

YoY Growth in quarter ended Dec 2025 is -99.86% vs 28,540.00% in Dec 2024
Half Yearly Results Snapshot (Standalone) - Sep'25
Growth in half year ended Sep 2025 is 0.00% vs 0.00% in Sep 2024

Growth in half year ended Sep 2025 is 258.33% vs 7.69% in Sep 2024
Nine Monthly Results Snapshot (Standalone) - Dec'25
YoY Growth in nine months ended Dec 2025 is 0.00% vs 0.00% in Dec 2024
YoY Growth in nine months ended Dec 2025 is -98.51% vs 7,933.33% in Dec 2024
Annual Results Snapshot (Standalone) - Mar'25
YoY Growth in year ended Mar 2025 is 0.00% vs 0.00% in Mar 2024
YoY Growth in year ended Mar 2025 is 5,520.83% vs 63.08% in Mar 2024
About Maruti Securities Ltd

Company Coordinates


