
Compare Maruti Suzuki with Similar Stocks
Dashboard
The company is Net-Debt Free
Healthy long term growth as Net Sales has grown by an annual rate of 21.10% and Operating profit at 45.43%
Positive results in Mar 26
With ROE of 13.7, it has a Attractive valuation with a 3.9 Price to Book Value
High Institutional Holdings at 38.3%
With its market cap of Rs 4,21,997 cr, it is the biggest company in the sector and constitutes 38.59% of the entire sector
Stock DNA
Automobiles
INR 417,762 Cr (Large Cap)
28.00
27
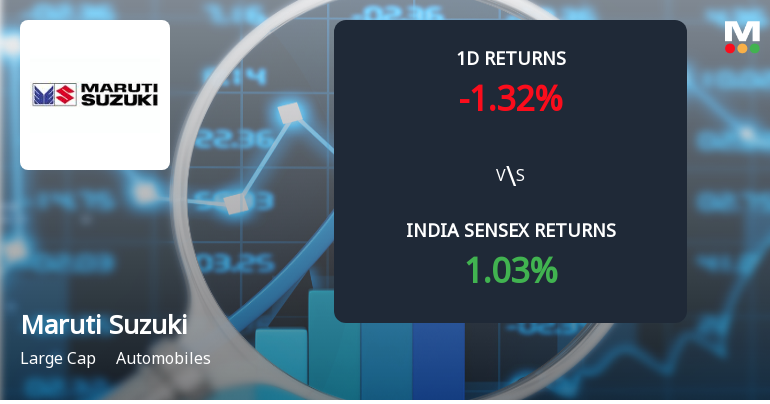
1.01%
-0.16
13.70%
3.94
Total Returns (Price + Dividend) 
Latest dividend: 135 per share ex-dividend date: Aug-01-2025
Risk Adjusted Returns v/s
Returns Beta

News
Maruti Suzuki Sees Sharp Open Interest Surge Amid Mixed Market Signals
Maruti Suzuki India Ltd has witnessed a notable 14.5% increase in open interest in its derivatives segment, signalling heightened market activity despite the stock’s recent underperformance. This surge in open interest, coupled with evolving volume patterns and shifting investor positioning, offers critical insights into potential directional bets and the stock’s near-term outlook within the automobile sector.
Read full news article
Maruti Suzuki India Sees Sharp Open Interest Surge Amid Mixed Market Signals
Maruti Suzuki India Ltd has witnessed a notable 12.9% increase in open interest in its derivatives segment, signalling heightened market activity and shifting investor positioning despite the stock’s recent underperformance relative to its sector and the broader Sensex.
Read full news article
Maruti Suzuki Sees Sharp Open Interest Surge Amid Bearish Price Action
Maruti Suzuki India Ltd has witnessed a notable surge in open interest in its derivatives segment, rising by 11.16% to 1,77,611 contracts, signalling increased market activity despite the stock's underperformance relative to its sector and the broader Sensex. This development highlights shifting market positioning and potential directional bets among traders amid a challenging price environment.
Read full news article Announcements
Closure of Trading Window
19-Jun-2026 | Source : BSEClosure of Trading Window
Announcement under Regulation 30 (LODR)-Newspaper Publication
18-Jun-2026 | Source : BSECopy of notice published in newspapers regarding transfer of equity shares of the Company to IEPF
Announcement under Regulation 30 (LODR)-Newspaper Publication
16-Jun-2026 | Source : BSECopy of notice published in newspaper
Corporate Actions

No Upcoming Board Meetings

Maruti Suzuki India Ltd has declared 2800% dividend, ex-date: 07 Aug 26

No Splits history available

No Bonus history available

No Rights history available
Quality key factors
Valuation key factors
Technicals key factors
 Technical Indicator Scale: Bearish, Mildly Bearish, Sideways, Mildly Bullish, Bullish Turned
 Shareholding Snapshot : Mar 2026
Shareholding Compare (%holding)
Promoters
None
Held by 45 Schemes (14.95%)
Held by 1026 FIIs (14.12%)
Suzuki Motor Corporation (58.53%)
Lici Index Plus Flexi Smart Growth Fund (4.6%)
2.68%
Quarterly Results Snapshot (Consolidated) - Mar'26 - YoY

YoY Growth in quarter ended Mar 2026 is 28.21% vs 6.37% in Mar 2025

YoY Growth in quarter ended Mar 2026 is -6.45% vs -1.04% in Mar 2025
Half Yearly Results Snapshot (Consolidated) - Sep'25
Growth in half year ended Sep 2025 is 10.54% vs 4.80% in Sep 2024
Growth in half year ended Sep 2025 is 4.07% vs 8.42% in Sep 2024
Nine Monthly Results Snapshot (Consolidated) - Dec'25
YoY Growth in nine months ended Dec 2025 is 16.84% vs 8.32% in Dec 2024
YoY Growth in nine months ended Dec 2025 is 4.07% vs 11.04% in Dec 2024
Annual Results Snapshot (Consolidated) - Mar'26
YoY Growth in year ended Mar 2026 is 19.88% vs 7.79% in Mar 2025
YoY Growth in year ended Mar 2026 is 1.24% vs 7.50% in Mar 2025
About Maruti Suzuki India Ltd

Company Coordinates


