
Compare Marvell Technology, Inc. with Similar Stocks
Dashboard
With a growth in Net Profit of 9.5%, the company declared Outstanding results in Jul 25
- The company has declared positive results for the last 2 consecutive quarters
- OPERATING CASH FLOW(Y) Highest at USD 1,844.8 MM
- ROCE(HY) Highest at -0.75%
- NET SALES(Q) Highest at USD 2,006.1 MM
With ROE of -1.14%, it has a risky valuation with a 4.43 Price to Book Value
High Institutional Holdings at 92.67%
Stock DNA
Other Electrical Equipment
USD 70,011 Million (Large Cap)
NA (Loss Making)
NA
0.30%
0.15
17.55%
4.98
Total Returns (Price + Dividend) 
Marvell Technology, Inc. for the last several years.
Risk Adjusted Returns v/s
News
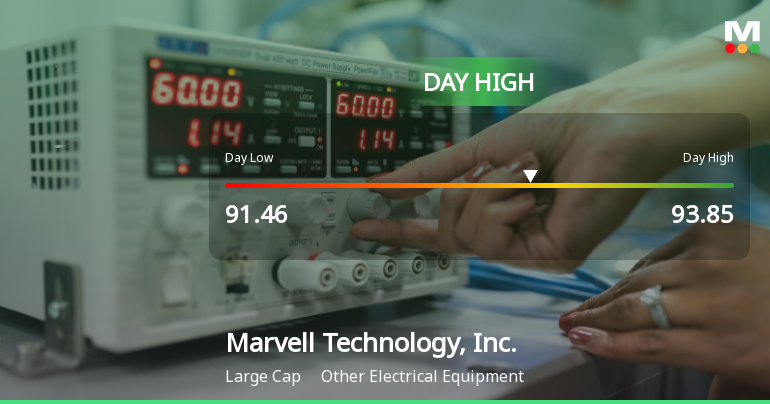
Marvell Technology Hits Day High with 3.9% Surge in Stock Price
Marvell Technology, Inc. has shown strong performance recently, with a notable increase on December 2, 2025. The company reported impressive financial metrics, including a 9.5% net profit growth and record operating cash flow. Additionally, it has high institutional holdings, reflecting strong investor confidence.
Read full news article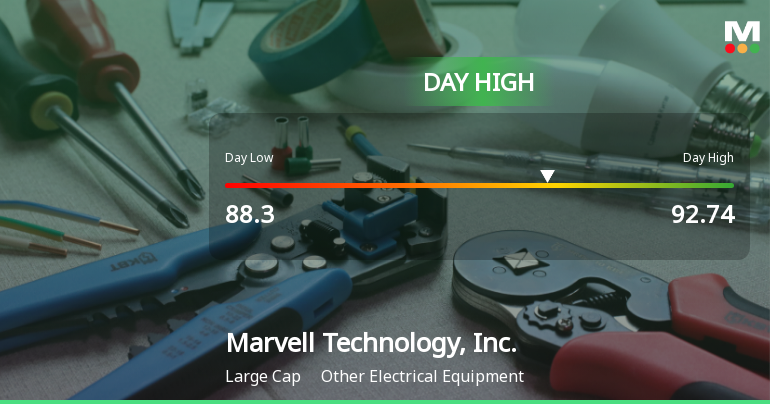
Marvell Technology Hits Day High with Strong 3.85% Intraday Surge
Marvell Technology, Inc. has seen a significant rise in stock performance, outperforming the S&P 500 over the past week. The company reported a 9.5% increase in net profit and achieved record operating cash flow and net sales. High institutional holdings reflect strong investor confidence despite year-to-date challenges.
Read full news article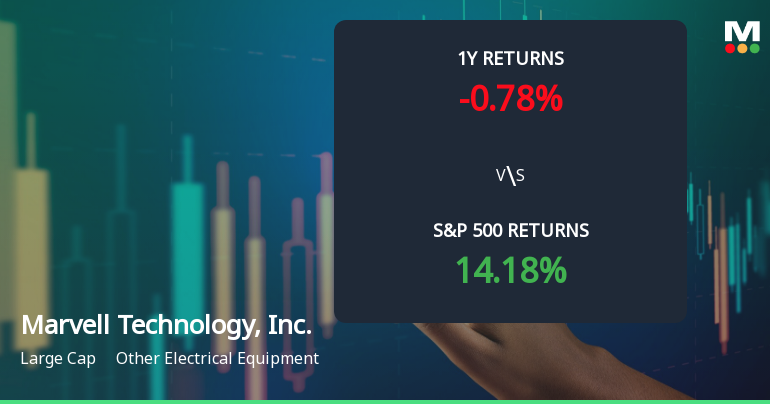
Marvell Technology, Inc. Experiences Revision in Stock Evaluation Amid Market Dynamics
Marvell Technology, Inc. has recently revised its evaluation amid changing market conditions. The stock price is currently $89.40, reflecting notable volatility over the past year. Technical indicators present a mixed outlook, while Marvell has outperformed the S&P 500 in the short term but has seen a decline year-to-date.
Read full news article Announcements

Corporate Actions
Quality key factors
Valuation key factors
Technicals key factors
 Technical Indicator Scale: Bearish, Mildly Bearish, Sideways, Mildly Bullish, Bullish Turned
 Shareholding Snapshot : Oct 2025
Shareholding Compare (%holding)
Domestic Funds
Held in 166 Schemes (49.99%)
Held by 569 Foreign Institutions (23.6%)
Quarterly Results Snapshot (Consolidated) - Oct'25 - QoQ

QoQ Growth in quarter ended Oct 2025 is 3.41% vs 5.85% in Jul 2025

QoQ Growth in quarter ended Oct 2025 is 876.03% vs 9.50% in Jul 2025
Annual Results Snapshot (Consolidated) - Jan'25
YoY Growth in year ended Jan 2025 is 4.71% vs -6.96% in Jan 2024
YoY Growth in year ended Jan 2025 is 5.19% vs -470.89% in Jan 2024
About Marvell Technology, Inc.

Company Coordinates


