
Compare MAS FINANC SER with Similar Stocks
Dashboard
Strong Long Term Fundamental Strength with an average Return on Equity (ROE) of 12.79%
Healthy long term growth as Net Sales has grown by an annual rate of 26.04% and Operating profit at 24.12%
With a growth in Net Profit of 25.26%, the company declared Very Positive results in Mar 26
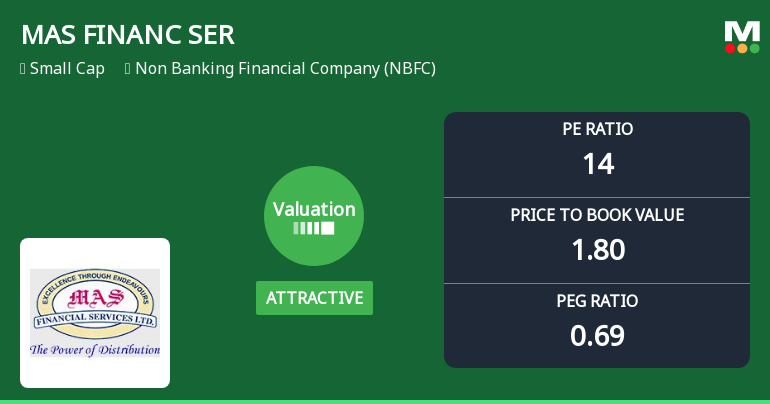
With ROE of 12.6, it has a Attractive valuation with a 1.9 Price to Book Value
High Institutional Holdings at 23.5%
Stock DNA
Non Banking Financial Company (NBFC)
INR 5,616 Cr (Small Cap)
15.00
20
0.64%
3.47
12.60%
1.80
Total Returns (Price + Dividend) 
Latest dividend: 1.1971236816874402 per share ex-dividend date: Feb-04-2026
Risk Adjusted Returns v/s
Returns Beta

News
MAS Financial Services Ltd Valuation Shifts Signal Attractive Entry Point
MAS Financial Services Ltd has seen a notable shift in its valuation parameters, moving from a fair to an attractive rating, driven by a significant re-rating of its price-to-earnings and price-to-book value multiples relative to its historical averages and peer group. This repositioning comes amid a backdrop of elevated valuations across the NBFC sector, offering investors a compelling entry point in this small-cap financial services player.
Read full news article
MAS Financial Services Ltd is Rated Buy
MAS Financial Services Ltd is rated Buy by MarketsMOJO. This rating was last updated on 01 June 2026, reflecting a change from its previous 'Strong Buy' status. However, the analysis and financial metrics discussed here represent the stock's current position as of 08 June 2026, providing investors with the latest insights into its performance and outlook.
Read full news article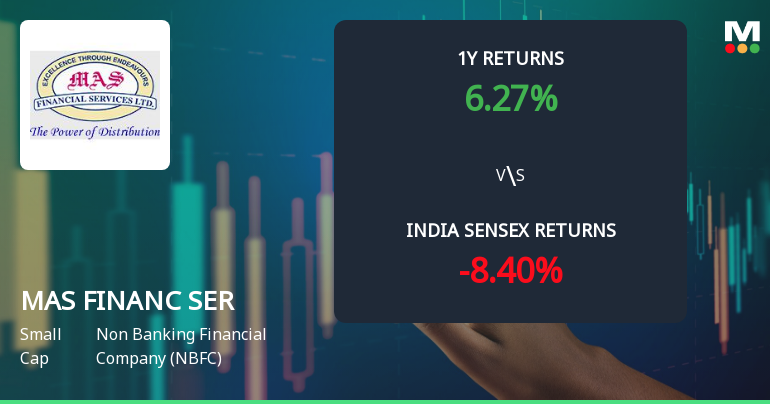
MAS Financial Services Ltd Technical Momentum Shifts Amid Mixed Market Signals
MAS Financial Services Ltd has experienced a nuanced shift in its technical momentum, moving from a bullish to a mildly bullish trend as of early June 2026. Despite a modest day decline of 2.14%, the stock’s technical indicators present a complex picture, with some signals pointing to sustained strength while others suggest caution. This analysis delves into the recent technical parameter changes, key momentum indicators, and the stock’s relative performance against the broader market.
Read full news article Announcements
Announcement under Regulation 30 (LODR)-Analyst / Investor Meet - Intimation
04-Jun-2026 | Source : BSEIntimation of Schedule of Analyst(s) / Investor(s) meetings
Compliances-Reg.24(A)-Annual Secretarial Compliance
29-May-2026 | Source : BSEAnnual Secretarial Compliance Report for the year ended on March 31 2026
Announcement under Regulation 30 (LODR)-Analyst / Investor Meet - Intimation
22-May-2026 | Source : BSEInvestor Meet Intimation
Corporate Actions

No Upcoming Board Meetings

MAS Financial Services Ltd has declared 12% dividend, ex-date: 04 Feb 26

No Splits history available

MAS Financial Services Ltd has announced 2:1 bonus issue, ex-date: 22 Feb 24

No Rights history available
Quality key factors
Valuation key factors
Technicals key factors
 Technical Indicator Scale: Bearish, Mildly Bearish, Sideways, Mildly Bullish, Bullish Turned
 Shareholding Snapshot : Mar 2026
Shareholding Compare (%holding)
Promoters
None
Held by 7 Schemes (14.5%)
Held by 88 FIIs (3.46%)
Shweta Kamlesh Gandhi (27.01%)
Nippon Life India Trustee Ltd-a/c Nippon India Small Cap Fund (8.03%)
7.24%
Quarterly Results Snapshot (Consolidated) - Mar'26 - YoY

YoY Growth in quarter ended Mar 2026 is 23.54% vs 26.56% in Mar 2025

YoY Growth in quarter ended Mar 2026 is 25.04% vs 18.90% in Mar 2025
Half Yearly Results Snapshot (Consolidated) - Sep'25
Growth in half year ended Sep 2025 is 26.40% vs 24.28% in Sep 2024
Growth in half year ended Sep 2025 is 18.49% vs 25.70% in Sep 2024
Nine Monthly Results Snapshot (Consolidated) - Dec'25
YoY Growth in nine months ended Dec 2025 is 25.43% vs 23.59% in Dec 2024
YoY Growth in nine months ended Dec 2025 is 17.63% vs 25.44% in Dec 2024
Annual Results Snapshot (Consolidated) - Mar'26
YoY Growth in year ended Mar 2026 is 24.91% vs 24.42% in Mar 2025
YoY Growth in year ended Mar 2026 is 19.60% vs 23.63% in Mar 2025
About MAS Financial Services Ltd

Company Coordinates


