
Compare Mastek with Similar Stocks
Dashboard
High Management Efficiency with a high ROE of 17.53%
Company has a Debt to Equity ratio (avg) of 0.02 times
Poor long term growth as Operating profit has grown by an annual rate 9.93% of over the last 5 years
Positive results in Mar 26
With ROE of 14.3, it has a Attractive valuation with a 1.7 Price to Book Value
High Institutional Holdings at 27.05%
Underperformed the market in the last 1 year
Stock DNA
Computers - Software & Consulting
INR 5,011 Cr (Small Cap)
12.00
20
1.52%
-0.17
14.34%
1.63
Total Returns (Price + Dividend) 
Latest dividend: 8 per share ex-dividend date: Jan-30-2026
Risk Adjusted Returns v/s
Returns Beta

News

Mastek Ltd is Rated Hold by MarketsMOJO
Mastek Ltd is rated 'Hold' by MarketsMOJO, with this rating last updated on 19 January 2026. However, the analysis and financial metrics discussed below reflect the stock's current position as of 14 June 2026, providing investors with an up-to-date view of the company’s performance and outlook.
Read full news article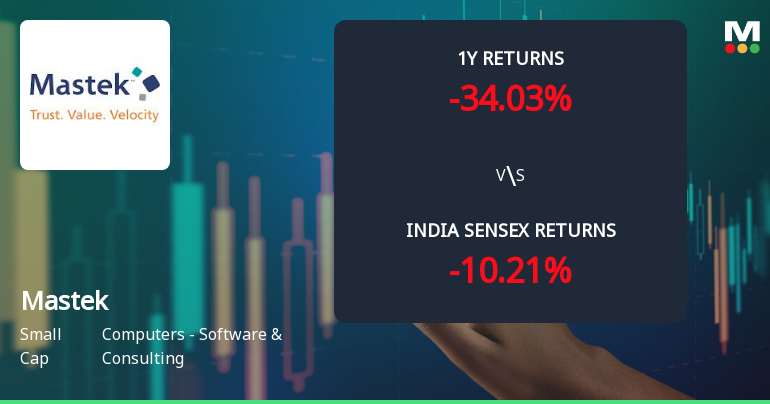
Mastek Ltd Technical Momentum Shifts Amid Bearish Market Sentiment
Mastek Ltd, a small-cap player in the Computers - Software & Consulting sector, has experienced a notable shift in its technical momentum, moving from a mildly bearish stance to a more pronounced bearish trend. Despite some mildly bullish signals on weekly indicators, the overall technical landscape suggests caution for investors as the stock continues to underperform key benchmarks such as the Sensex.
Read full news article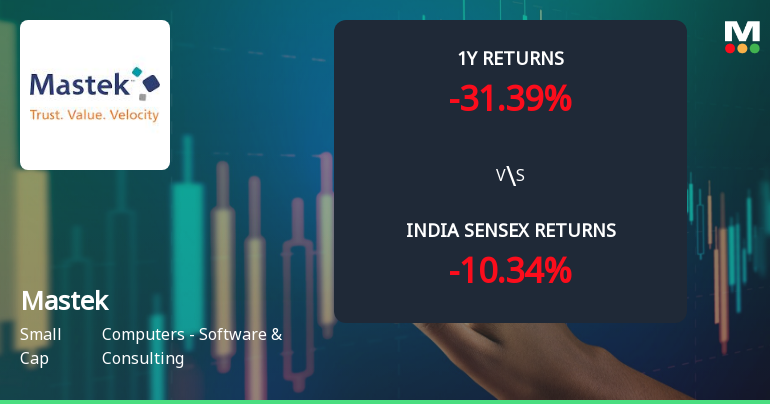
Mastek Ltd Technical Momentum Shifts Amid Mixed Market Signals
Mastek Ltd, a small-cap player in the Computers - Software & Consulting sector, has experienced a nuanced shift in its technical momentum, reflecting a complex interplay of bullish and bearish signals across multiple timeframes. Recent technical parameter changes indicate a mild improvement from a previously bearish stance, yet the stock continues to face headwinds amid broader market challenges and subdued relative performance versus the Sensex.
Read full news article Announcements
Re-Submission Pursuant To Clarification Sought By BSE Limited
04-Jun-2026 | Source : BSEMastek Limited has informed the Exchange about re-submission of Intimation regarding receipt of Final Assessment Order from the Income Tax Department for FY 2022-23 pursuant to clarification sought by BSE Limited.
Intimation Of Receipt Of Final Assessment Order From The Income Tax Department For The FY 2022-23.
03-Jun-2026 | Source : BSEIntimation of receipt of Final Assessment Order from the Income Tax Department for the FY 2022-23.
Announcement under Regulation 30 (LODR)-Newspaper Publication
29-May-2026 | Source : BSENewspaper Publication regarding proposed transfer of shares to IEPF Authority and Special Window for re-lodgement of physical transfer requests
Corporate Actions

No Upcoming Board Meetings

Mastek Ltd has declared 160% dividend, ex-date: 30 Jan 26

No Splits history available

Mastek Ltd has announced 1:1 bonus issue, ex-date: 27 Mar 06

No Rights history available
Quality key factors
Valuation key factors
Technicals key factors
 Technical Indicator Scale: Bearish, Mildly Bearish, Sideways, Mildly Bullish, Bullish Turned
 Shareholding Snapshot : Mar 2026
Shareholding Compare (%holding)
Non Institution
None
Held by 13 Schemes (14.94%)
Held by 114 FIIs (8.03%)
Ashank Datta Desai (10.95%)
Umang Tejkaran Nahata (5.48%)
18.73%
Quarterly Results Snapshot (Consolidated) - Mar'26 - QoQ

QoQ Growth in quarter ended Mar 2026 is 3.57% vs -3.69% in Dec 2025

QoQ Growth in quarter ended Mar 2026 is -2.03% vs 11.19% in Dec 2025
Half Yearly Results Snapshot (Consolidated) - Sep'25
Growth in half year ended Sep 2025 is 10.40% vs 12.71% in Sep 2024
Growth in half year ended Sep 2025 is -5.32% vs 50.59% in Sep 2024
Nine Monthly Results Snapshot (Consolidated) - Dec'25
YoY Growth in nine months ended Dec 2025 is 8.27% vs 12.08% in Dec 2024
YoY Growth in nine months ended Dec 2025 is 1.01% vs 41.60% in Dec 2024
Annual Results Snapshot (Consolidated) - Mar'26
YoY Growth in year ended Mar 2026 is 7.05% vs 13.11% in Mar 2025
YoY Growth in year ended Mar 2026 is 7.47% vs 25.19% in Mar 2025
About Mastek Ltd

Company Coordinates


