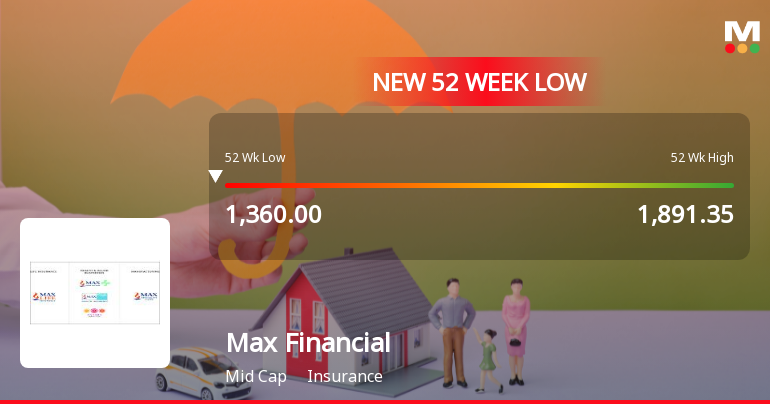
Max Financial

INR
1,566.30
-18.15 (-1.15%)
BSENSE

Aug 19, 12:49 PM

BSE+NSE Vol: 1.53 lacs

  • Price Points
  • Score
  • Mojo Parameters
  • Total Return
  • News and Corporate Actions
  • Key factors
  • Shareholding
  • Financials
  • CompanyCV
stock-summaryPrice Point
High/Low

1Day

52 Week

Valuation
Technical
Day's Volume

CASH

1.53 lacs (-81.92%) Volume

Shareholding (Jun 2026)

FII

48.06%

Held by 362 FIIs

DII

44.34%

Held by 89 DIIs

Promoter

1.25%

Why is Max Financial Services Ltd falling/rising?

19-Aug-2026

As of 18-Aug, Max Financial Services Ltd's stock price has risen to 1,584.45, up 1.11%, driven by strong recent performance and positive financial results. Despite concerns over long-term growth and high valuations, the stock has outperformed its sector and shows a favorable short-term outlook.

As of 18-Aug, Max Financial Services Ltd is experiencing a rise in its stock price, currently at 1,584.45, with a change of 17.45 (1.11%) upwards. This upward movement can be attributed to several factors. Firstly, the stock has outperformed its sector by 1.06% today and has shown a consecutive gain over the last three days, accumulating a total return of 4.92% during this period. Additionally, the stock's performance over the past week and month has been positive, with increases of 5.63% and 3.05%, respectively, while the benchmark Sensex has declined by 1.18% and 1.17% in the same timeframes.<BR><BR>Moreover, the company has recently declared positive results for June 2026, marking a turnaround after four consecutive quarters of negative performance. Key financial indicators such as cash and cash equivalents are at their highest level of Rs 2,137.15 crore, net sales have reached Rs 14,969.51 crore, and PBDIT is also at a peak of Rs 166.85 crore. These results contribute to a more favorable outlook for the company, despite some concerns regarding long-term growth and high valuations.<BR><BR>However, it is important to note that there are negative factors that could impact the stock's performance in the future, such as poor long-term growth rates and a high percentage of pledged promoter shares, which can exert downward pressure in a falling market. Nonetheless, the current rise in stock price reflects the recent positive developments and short-term performance metrics.

View full answer

Should I buy, sell or hold Max Financial Services Ltd?

15-Aug-2026

Who are in the management team of Max Financial?

14-Aug-2026

The management team of Max Financial includes Chairman Analjit Singh and nine directors, comprising both executive and independent members, such as Aman Mehta, Dinesh Kumar Mittal, and K Narasimha Murthy, bringing diverse expertise to the company.

The management team of Max Financial includes the following members:<BR><BR>1. **Analjit Singh** - Chairman (Non-Executive)<BR>2. **Aman Mehta** - Non-Executive & Independent Director<BR>3. **Dinesh Kumar Mittal** - Non-Executive & Independent Director<BR>4. **Sahil Vachani** - Non-Executive Director<BR>5. **Jai Arya** - Non-Executive & Independent Director<BR>6. **Charles Richard Vernon Stagg** - Non-Executive & Independent Director<BR>7. **Hideaki Nomura** - Director<BR>8. **Mitsuru Yasuda** - Director<BR>9. **K Narasimha Murthy** - Independent Director<BR>10. **Gauri Padmanabhan** - Independent Director<BR><BR>This diverse group of directors brings a range of expertise and experience to the company.

View full answer

What does Max Financial do?

14-Aug-2026

Max Financial Services Ltd is a holding company for Max Life Insurance, operating in the insurance sector with a market cap of INR 51,971 Cr. As of June 2026, it reported net sales of 14,970 Cr and a net profit of 96 Cr.

Overview:<BR>Max Financial Services Ltd is a holding company for Max Life Insurance Company Limited, operating in the insurance industry and categorized as a mid-cap company.<BR><BR>History:<BR>Max Financial Services Limited was originally incorporated as 'Max India Limited' in 1988 and changed its name on January 15, 2016. The latest quarterly results reported net sales and net profit for June 2026.<BR><BR>Financial Snapshot:<BR>Net Sales: 14,970 Cr (Quarterly Results - Jun 2026) <BR>Net Profit: 96 Cr (Quarterly Results - Jun 2026) <BR>Market Cap: INR 51,971 Cr (Mid Cap)<BR><BR>Key Metrics:<BR>P/E: 630.00 <BR>Industry P/E: 21 <BR>Dividend Yield: 0.00% <BR>Debt-Equity: 0.35 <BR>Return on Equity: 1.57% <BR>Price to Book: 9.96 <BR><BR>Contact Details:<BR>Address: Bhai Mohan Singh Nagar, Railmajra Tehsil Balachaur Nawanshahr Punjab : 144533 <BR>Tel: 91-01881-462000 <BR>Email: investorhelpline@maxindia.com <BR>Website: http://www.maxfinancialservices.com

View full answer

Who are the peers of the Max Financial?

14-Aug-2026

Max Financial's peers include SBI Life Insurance, HDFC Life Insurance, ICICI Lombard, ICICI Prudential Life, General Insurance, Star Health Insurance, New India Assurance, Go Digit General, and Niva Bupa Health. Their management risks range from excellent to below average, with varying growth rates and returns, where Max Financial's 1-year return is -4.90%.

Peers: The peers of Max Financial are SBI Life Insuran, HDFC Life Insur., ICICI Lombard, ICICI Pru Life, General Insuranc, Star Health Insu, New India Assura, Go Digit General, and Niva Bupa Health.<BR><BR>Quality Snapshot: Excellent management risk is observed at ICICI Lombard and Go Digit General, while Average management risk is found at SBI Life Insuran, HDFC Life Insur., ICICI Pru Life, General Insuranc, Max Financial, Star Health Insu, and Niva Bupa Health, and Below Average management risk is noted at New India Assura. Growth is rated as Excellent for Niva Bupa Health, Good for SBI Life Insuran, while Average growth is seen at HDFC Life Insur., General Insuranc, and Go Digit General, and Below Average growth is reported for ICICI Pru Life, Max Financial, Star Health Insu, and New India Assura. All peers have an Excellent capital structure.<BR><BR>Return Snapshot: The peer with the highest 1-year return is Star Health Insu at 31.46%, while Go Digit General has the lowest at -27.34%. Max Financial's 1-year return of -4.90% is better than Go Digit General's but worse than Star Health Insu's. Additionally, the six-month return is negative for SBI Life Insuran, HDFC Life Insur., ICICI Lombard, ICICI Pru Life, General Insuranc, Max Financial, and Go Digit General.

View full answer

How big is Max Financial?

14-Aug-2026

As of 14th August, Max Financial Services Ltd has a market capitalization of 53,629.11 Cr, with recent net sales of 49,821.97 Cr and a net profit of 109.89 Cr over the latest four quarters.

As of 14th August, <BR><BR>Market Cap: Max Financial Services Ltd has a market capitalization of 53,629.11 Cr, classifying it as a Mid Cap company.<BR><BR>Recent Quarterly Performance: The sum of Net Sales for the latest 4 quarters is 49,821.97 Cr, while the sum of Net Profit for the same period is 109.89 Cr.<BR><BR>Balance Sheet Snapshot: The reporting period is March 2026, with Shareholder's Funds amounting to 5,281.79 Cr and Total Assets totaling 1,98,906.84 Cr.

View full answer

Are Max Financial Services Ltd latest results good or bad?

13-May-2026

Max Financial Services Ltd's latest results are concerning, reporting a consolidated net loss of ₹26.35 crores in Q4 FY26, a 184.16% decline year-on-year, with net sales down 12.72% and negative operating margins. This indicates significant operational challenges and underperformance compared to industry peers.

Max Financial Services Ltd's latest results are concerning and can be classified as bad. In the fourth quarter of FY26, the company reported a consolidated net loss of ₹26.35 crores, which represents a dramatic decline of 184.16% year-on-year. This marks a significant deterioration in profitability, as the company faced declining revenues and compressed margins.<BR><BR>Net sales for the quarter fell to ₹10,801.94 crores, down 12.72% compared to the same period last year, and operating margins dropped to negative territory at -0.06%. These figures indicate serious operational challenges, as the company has struggled to maintain profitability amidst rising interest expenses and declining sales.<BR><BR>Additionally, the return on equity of 7.79% is below the average for its peers in the insurance sector, further highlighting the company's underperformance. The stock has also seen a decline in value, trading down 1.82% following the results announcement, which reflects investor sentiment regarding its financial health.<BR><BR>Overall, the combination of losses, declining sales, and negative operating margins suggests that Max Financial Services is currently navigating a difficult period, raising concerns about its future performance and stability.

View full answer

Is Max Financial technically bullish or bearish?

05-Dec-2025

As of December 4, 2025, Max Financial's trend is mildly bullish, supported by bullish MACD and moving averages, but tempered by bearish momentum in the weekly RSI and mixed signals from KST, indicating a cautious outlook.

As of 4 December 2025, the technical trend for Max Financial has changed from bullish to mildly bullish. The current stance is mildly bullish, supported by a bullish MACD on both weekly and monthly time frames, and bullish moving averages on the daily chart. However, the weekly RSI indicates bearish momentum, which tempers the overall bullish outlook. The Bollinger Bands are also showing a mildly bullish trend on both weekly and monthly charts. KST is mildly bearish on the weekly but bullish on the monthly, indicating mixed signals. Dow Theory shows no trend on both weekly and monthly time frames, and OBV is neutral. Overall, while there are bullish indicators, the presence of bearish signals in the RSI and KST suggests caution.

View full answer

How has been the historical performance of Max Financial?

13-Nov-2025

Max Financial's historical performance shows fluctuating net sales, peaking at 46,468.91 Cr in March 2025, with operating profit rising to 472.00 Cr, despite a slight decline in profit after tax to 406.74 Cr. Total assets increased significantly, indicating growth, while cash flow from operations improved, enhancing liquidity.

Answer:<BR>Max Financial's historical performance shows a fluctuating trend in net sales and profits over the years, with net sales reaching 46,468.91 Cr in March 2025, a slight decrease from 46,575.62 Cr in March 2024, but a significant increase from 31,412.67 Cr in March 2023. The total operating income mirrored this trend, with 46,468.91 Cr in March 2025 compared to 46,575.62 Cr in the previous year. Operating profit (PBDIT) excluding other income was 472.00 Cr in March 2025, up from 424.93 Cr in March 2024, although it was lower than the 550.90 Cr recorded in March 2023. Profit before tax also showed a positive trend, increasing to 450.10 Cr in March 2025 from 416.10 Cr in March 2024, while profit after tax was 406.74 Cr in March 2025, slightly up from 393.52 Cr in March 2024. The consolidated net profit for March 2025 was 327.21 Cr, down from 340.08 Cr in March 2024. The company's total assets grew to 1,89,998.69 Cr in March 2025 from 1,62,771.45 Cr in March 2024, while total liabilities also increased to 1,89,998.69 Cr from 1,62,771.45 Cr in the same period. Cash flow from operating activities improved to 8,351.00 Cr in March 2025 from 6,104.00 Cr in March 2024, contributing to a net cash inflow of 609.00 Cr in March 2025.<BR><BR>Breakdown:<BR>Max Financial's net sales have shown a general upward trajectory, peaking at 46,468.91 Cr in March 2025, although it experienced a slight decline from the previous year. The operating profit, while fluctuating, increased to 472.00 Cr in March 2025, indicating improved operational efficiency despite a drop in profit after tax to 406.74 Cr. The total assets of the company have significantly increased, reflecting growth in its financial base, while total liabilities rose correspondingly, indicating a potential increase in leverage. Cash flow from operating activities also saw a positive shift, enhancing the company's liquidity position. Overall, while there are fluctuations in profitability, the growth in sales and assets suggests a robust operational framework for Max Financial.

View full answer

How has been the historical performance of Max Financial?

12-Nov-2025

Max Financial's net sales reached 46,468.91 Cr in March 2025, showing growth from the previous year despite a slight decline from March 2024. While profit before tax and profit after tax increased, consolidated net profit fell to 327.21 Cr, indicating profitability challenges despite improved sales and cash flow.

Answer:<BR>Max Financial has shown a varied historical performance over the years, with net sales reaching 46,468.91 Cr in March 2025, slightly down from 46,575.62 Cr in March 2024 but significantly higher than 31,412.67 Cr in March 2023. The total operating income mirrored this trend, with a peak in March 2024 before a slight decline in March 2025. The operating profit (PBDIT) for March 2025 was 452.97 Cr, down from 462.85 Cr in the previous year, while profit before tax increased to 450.10 Cr from 416.10 Cr. The profit after tax also saw a rise to 406.74 Cr in March 2025 from 393.52 Cr in March 2024. However, the consolidated net profit decreased to 327.21 Cr in March 2025 from 340.08 Cr in March 2024, reflecting a decline in profitability despite an increase in sales. <BR><BR>In terms of assets and liabilities, total assets rose to 1,89,998.69 Cr in March 2025 from 1,62,771.45 Cr in March 2024, while total liabilities also increased to 1,89,998.69 Cr from 1,62,771.45 Cr. The company’s cash flow from operating activities improved to 8,351.00 Cr in March 2025 from 6,104.00 Cr in March 2024, contributing to a net cash inflow of 609.00 Cr, although this was lower than the previous year's inflow of 986.00 Cr. Overall, while Max Financial has experienced growth in sales and operating cash flow, its profitability metrics have shown some fluctuations, indicating a need for strategic adjustments moving forward. <BR><BR>Breakdown:<BR>Max Financial's net sales have shown a consistent upward trend, reaching 46,468.91 Cr in March 2025, although this represents a slight decline from the previous year. The total operating income followed a similar pattern, peaking in March 2024 before a minor drop. Operating profit (PBDIT) decreased to 452.97 Cr in March 2025, while profit before tax increased to 450.10 Cr, indicating improved operational efficiency despite lower sales. Profit after tax rose to 406.74 Cr, yet the consolidated net profit fell to 327.21 Cr, reflecting challenges in maintaining profitability. On the balance sheet, total assets increased significantly to 1,89,998.69 Cr, alongside a rise in total liabilities, indicating a growing financial footprint. Cash flow from operating activities improved, leading to a net cash inflow, although it was lower than the previous year, suggesting potential areas for improvement in cash management.

View full answer

Who are the top shareholders of the Max Financial?

17-Jul-2025

The top shareholders of Max Financial include foreign institutional investors (FIIs) with 44.75% and mutual funds with 39.88%. Mitsui Sumitomo Insurance Company Limited is the largest public shareholder at 21.86%, while Max Ventures Investment Holdings Private Limited is the main promoter with 1.62%.

The top shareholders of Max Financial include a mix of foreign institutional investors (FIIs) and mutual funds. FIIs hold a significant portion, accounting for 44.75% of the shares. Mutual funds are also substantial shareholders, with 39.88% held across 32 schemes. <BR><BR>Among individual shareholders, Mitsui Sumitomo Insurance Company Limited stands out as the highest public shareholder, holding 21.86% of the shares. The promoter with the highest holding is Max Ventures Investment Holdings Private Limited, which holds 1.62%. Additionally, individual investors collectively own 4.58% of the company. <BR><BR>Overall, the majority of the shares are held by FIIs, indicating strong foreign interest in Max Financial.

View full answer

Is Max Financial overvalued or undervalued?

09-Jun-2025

As of January 2, 2025, Max Financial is considered very expensive and overvalued with a PE ratio of 158.37 and significantly higher valuation ratios compared to industry peers, indicating that investors may be overestimating its future growth potential despite recent strong stock performance.

As of 2 January 2025, the valuation grade for Max Financial has moved from fair to very expensive. The company is currently deemed overvalued based on its high valuation ratios, including a PE ratio of 158.37, an EV to EBIT of 111.74, and an EV to EBITDA of 111.04. These figures starkly contrast with its peers, such as Life Insurance, which has a PE ratio of 12.54 and an EV to EBITDA of 9.89, indicating a significant premium for Max Financial compared to the industry average.<BR><BR>In comparison to other competitors, Bajaj Finance is also categorized as very expensive with a PE ratio of 35.01, while SBI Life Insurance is considered very attractive with a PE of 74.03. Given these metrics, Max Financial's current valuation appears unsustainable, especially when considering its relatively low ROE of 6.24% and ROCE of 9.00%. Although the stock has outperformed the Sensex over various time frames, including a 60.80% return over the past year compared to the Sensex's 7.62%, the current valuation suggests that investors may be overestimating future growth potential.

View full answer

When is the next results date for Max Financial?

06-Jun-2025

No Upcoming Board Meetings

Has Max Financial declared dividend?

06-Jun-2025

Yes, Max Financial Services Ltd has declared a dividend of 90% (₹1.8 per share) with an ex-date of September 19, 2016. However, the dividend yield is 0%, indicating that returns have primarily come from price appreciation rather than dividend income.

Max Financial Services Ltd has declared a dividend.<BR><BR>Dividend Details:<BR>- Percentage announced: 90%<BR>- Amount per share: 1.8<BR>- Ex-date: Sep-19-2016<BR><BR>Dividend Yield: 0%<BR><BR>Total Returns by Period:<BR>In the 6-month period, the price return was 30.15%, the dividend return was 0%, resulting in a total return of 30.15%.<BR><BR>In the 1-year period, the price return was 63.09%, the dividend return was 0%, resulting in a total return of 63.09%.<BR><BR>In the 2-year period, the price return was 119.47%, the dividend return was 0%, resulting in a total return of 119.47%.<BR><BR>In the 3-year period, the price return was 85.7%, the dividend return was 0%, resulting in a total return of 85.7%.<BR><BR>In the 4-year period, the price return was 58.23%, the dividend return was 0%, resulting in a total return of 58.23%.<BR><BR>In the 5-year period, the price return was 219.9%, the dividend return was 0%, resulting in a total return of 219.9%.<BR><BR>Overall, while Max Financial Services Ltd has declared a dividend, the dividend yield remains at 0%, indicating that the returns have been primarily driven by price appreciation rather than dividend income. The total returns over various periods show significant growth, particularly over the 5-year period.

View full answer
iScoreScore
Click here to find our call on this stock
Strong Sell
Sell
Hold
Buy
Strong Buy

Dashboard

1

Poor long term growth as Operating profit has grown by an annual rate of -11.63%

 
2

With ROE of 1.6, it has a Very Expensive valuation with a 10.4 Price to Book Value

3

26.92% of Promoter Shares are Pledged

stock-summaryMojo Parameters

Mojo Parameters

Loading Valuation Snapshot...

Stock DNA

stock-summary
Industry

Insurance

stock-summary
Market cap

INR 54,055 Cr (Mid Cap)

stock-summary
P/E

505.00

stock-summary
Industry P/E

21

stock-summary
Dividend Yield

0.00%

stock-summary
Debt Equity

0.35

stock-summary
Return on Equity

1.57%

stock-summary
Price to Book

10.35

Revenue and Profits:
Net Sales:
14,970 Cr
(Quarterly Results - Jun 2026)
Net Profit:
96 Cr
stock-summaryTotal Returns
Total Returns (Price + Dividend) stock-summary
Dividend Yield (0%)
TimePeriod
Price Return
Dividend Return
Total Return
3 Months
-3.2%
0%
-3.2%
6 Months
-14.5%
0%
-14.5%
1 Year
-4.25%
0%
-4.25%
2 Years
58.05%
0%
58.05%
3 Years
79.66%
0%
79.66%
4 Years
92.69%
0%
92.69%
5 Years
46.83%
0%
46.83%

Latest dividend: 1.8 per share ex-dividend date: Sep-19-2016

Risk Adjusted Returns v/s stock-summary
Returns Beta
Icon
Beta has not been calculated since enough price history is not available
stock-summaryNews & Corporate Actions

News

Max Financial Services Gains 2.84%: 4 Key Factors Driving the Week’s Mixed Signals

Announcements stock-summary

Announcement under Regulation 30 (LODR)-Newspaper Publication

15-Aug-2026 | Source : BSE

Newspaper publications of unaudited financial results for the quarter ended June 30 2026

Board Meeting Outcome for Outcome Of Board Meeting - Approval Of Unaudited Standalone And Consolidated Financial Results Of The Company For The Quarter Ended June 30 2026

13-Aug-2026 | Source : BSE

Approval of unaudited standalone and consolidated financial results of the Company for the quarter ended June 30 2026

Approval Of Unaudited Standalone And Consolidated Financial Results Of The Company For The Quarter Ended June 30 2026

13-Aug-2026 | Source : BSE

As per the disclosure attached

Corporate Actions stock-summary

stock-summary
BOARD MEETING

No Upcoming Board Meetings

stock-summary
DIVIDEND

Max Financial Services Ltd has declared 90% dividend, ex-date: 19 Sep 16

stock-summary
SPLITS

Max Financial Services Ltd has announced 2:10 stock split, ex-date: 12 Mar 07

stock-summary
BONUS

No Bonus history available

stock-summary
RIGHTS

No Rights history available

stock-summaryKey Factors

Quality key factors stock-summary

Factor
Value
Sales Growth (5y)
9.46%
EBIT Growth (5y)
-11.63%
Net Debt to Equity (avg)
0.35
Institutional Holding
92.40%
ROE (avg)
6.77%

Valuation key factors

Factor
Value
P/E Ratio
505
Industry P/E
21
Price to Book Value
10.35
EV to EBIT
173.38
EV to EBITDA
171.95
EV to Capital Employed
-9.48
EV to Sales
0.90
PEG Ratio
NA
Dividend Yield
NA
ROCE (Latest)
Negative Capital Employed
ROE (Latest)
1.57%

Technicals key factors

Indicator
Weekly
Monthly
MACD
Bearish
Mildly Bearish
RSI
No Signal
No Signal
Bollinger Bands
Mildly Bearish
Bullish
Moving Averages
Mildly Bearish (Daily)
KST
Bearish
Mildly Bearish
Dow Theory
Mildly Bullish
Mildly Bearish
OBV
Mildly Bearish
Mildly Bearish
stock-summary Technical Indicator Scale: Bearish, Mildly Bearish, Sideways, Mildly Bullish, Bullish  Turned 
stock-summaryShareholding
Shareholding Snapshot : Jun 2026stock-summary
Shareholding Compare (%holding) stock-summary
Majority shareholders

FIIs

Pledged Promoter Holdings

26.9219

Mutual Funds

Held by 41 Schemes (36.76%)

FIIs

Held by 362 FIIs (48.06%)

Promoter with highest holding

Max Ventures Investment Holdings Private Limited (1.16%)

Highest Public shareholder

Mitsui Sumitomo Insurance Company Limited (21.86%)

Individual Investors Holdings

4.65%

stock-summaryFinancial
[
  {
    "link": "quarterly",
    "btn_text": "All Quarterly Results",
    "header": "Quarterly Results Snapshot (Consolidated) - Jun'26 - YoY",
    "rhs": [
      {
        "prefix": "Net Sales ",
        "suffix": "YoY Growth in quarter ended Jun 2026 is 16.75% vs 8.67% in Jun 2025",
        "dir": 1
      },
      {
        "prefix": "Consolidated Net Profit ",
        "suffix": "YoY Growth in quarter ended Jun 2026 is 37.22% vs -45.29% in Jun 2025",
        "dir": 1
      }
    ],
    "table": {
      "header": [
        "Jun'26",
        "Jun'25",
        "Change(%)"
      ],
      "body": [
        {
          "field": "Net Sales",
          "val1": "14,969.51",
          "val2": "12,821.65",
          "chgp": "16.75%",
          "chgp_class": "positive"
        },
        {
          "field": "Operating Profit (PBDIT) excl Other Income",
          "val1": "166.85",
          "val2": "118.59",
          "chgp": "40.69%",
          "chgp_class": "positive"
        },
        {
          "field": "Interest",
          "val1": "35.53",
          "val2": "19.68",
          "chgp": "80.54%",
          "chgp_class": "negative"
        },
        {
          "field": "Exceptional Items",
          "val1": "0.00",
          "val2": "-0.53",
          "chgp": "100.00%",
          "chgp_class": "positive"
        },
        {
          "field": "Consolidate Net Profit",
          "val1": "95.56",
          "val2": "69.64",
          "chgp": "37.22%",
          "chgp_class": "positive"
        },
        {
          "field": "Operating Profit Margin (Excl OI)",
          "val1": "1.11%",
          "val2": "0.92%",
          "chgp": "0.19%",
          "chgp_class": "positive"
        }
      ]
    }
  },
  {
    "link": "half-yearly",
    "btn_text": "All Half Yearly Results",
    "header": "Half Yearly Results Snapshot (Consolidated) - Sep'25",
    "rhs": [
      {
        "prefix": "Net Sales ",
        "suffix": " Growth in half year ended Sep 2025 is -10.16% vs 30.20% in Sep 2024",
        "dir": -1
      },
      {
        "prefix": "Consolidated Net Profit ",
        "suffix": " Growth in half year ended Sep 2025 is -69.25% vs 1.82% in Sep 2024",
        "dir": -1
      }
    ],
    "table": {
      "header": [
        "Sep'25",
        "Sep'24",
        "Change(%)"
      ],
      "body": [
        {
          "field": "Net Sales",
          "val1": "22,613.24",
          "val2": "25,170.47",
          "chgp": "-10.16%",
          "chgp_class": "negative"
        },
        {
          "field": "Operating Profit (PBDIT) excl Other Income",
          "val1": "139.60",
          "val2": "363.40",
          "chgp": "-61.59%",
          "chgp_class": "negative"
        },
        {
          "field": "Interest",
          "val1": "40.80",
          "val2": "21.83",
          "chgp": "86.90%",
          "chgp_class": "negative"
        },
        {
          "field": "Exceptional Items",
          "val1": "-0.57",
          "val2": "-1.22",
          "chgp": "53.28%",
          "chgp_class": "positive"
        },
        {
          "field": "Consolidate Net Profit",
          "val1": "73.76",
          "val2": "239.85",
          "chgp": "-69.25%",
          "chgp_class": "negative"
        },
        {
          "field": "Operating Profit Margin (Excl OI)",
          "val1": "0.62%",
          "val2": "1.44%",
          "chgp": "-0.82%",
          "chgp_class": "negative"
        }
      ]
    }
  },
  {
    "link": "nine-monthly",
    "btn_text": "All Nine Monthly Results",
    "header": "Nine Monthly Results Snapshot (Consolidated) - Dec'25",
    "rhs": [
      {
        "prefix": "Net Sales ",
        "suffix": "YoY Growth in nine months ended Dec 2025 is 8.15% vs 7.59% in Dec 2024",
        "dir": 1
      },
      {
        "prefix": "Consolidated Net Profit ",
        "suffix": "YoY Growth in nine months ended Dec 2025 is -62.72% vs -22.97% in Dec 2024",
        "dir": -1
      }
    ],
    "table": {
      "header": [
        "Dec'25",
        "Dec'24",
        "Change(%)"
      ],
      "body": [
        {
          "field": "Net Sales",
          "val1": "36,872.17",
          "val2": "34,093.14",
          "chgp": "8.15%",
          "chgp_class": "positive"
        },
        {
          "field": "Operating Profit (PBDIT) excl Other Income",
          "val1": "217.61",
          "val2": "442.00",
          "chgp": "-50.77%",
          "chgp_class": "negative"
        },
        {
          "field": "Interest",
          "val1": "76.73",
          "val2": "32.06",
          "chgp": "139.33%",
          "chgp_class": "negative"
        },
        {
          "field": "Exceptional Items",
          "val1": "-0.56",
          "val2": "-1.41",
          "chgp": "60.28%",
          "chgp_class": "positive"
        },
        {
          "field": "Consolidate Net Profit",
          "val1": "110.32",
          "val2": "295.89",
          "chgp": "-62.72%",
          "chgp_class": "negative"
        },
        {
          "field": "Operating Profit Margin (Excl OI)",
          "val1": "0.59%",
          "val2": "1.30%",
          "chgp": "-0.71%",
          "chgp_class": "negative"
        }
      ]
    }
  },
  {
    "link": "annual",
    "btn_text": "All Annual Results",
    "header": "Annual Results Snapshot (Consolidated) - Mar'26",
    "rhs": [
      {
        "prefix": "Net Sales ",
        "suffix": "YoY Growth in year ended Mar 2026 is 2.59% vs -0.23% in Mar 2025",
        "dir": 1
      },
      {
        "prefix": "Consolidated Net Profit ",
        "suffix": "YoY Growth in year ended Mar 2026 is -74.34% vs -3.78% in Mar 2025",
        "dir": -1
      }
    ],
    "table": {
      "header": [
        "Mar'26",
        "Mar'25",
        "Change(%)"
      ],
      "body": [
        {
          "field": "Net Sales",
          "val1": "47,674.11",
          "val2": "46,468.91",
          "chgp": "2.59%",
          "chgp_class": "positive"
        },
        {
          "field": "Operating Profit (PBDIT) excl Other Income",
          "val1": "211.62",
          "val2": "472.00",
          "chgp": "-55.17%",
          "chgp_class": "negative"
        },
        {
          "field": "Interest",
          "val1": "111.86",
          "val2": "47.36",
          "chgp": "136.19%",
          "chgp_class": "negative"
        },
        {
          "field": "Exceptional Items",
          "val1": "1.12",
          "val2": "-3.36",
          "chgp": "133.33%",
          "chgp_class": "positive"
        },
        {
          "field": "Consolidate Net Profit",
          "val1": "83.97",
          "val2": "327.21",
          "chgp": "-74.34%",
          "chgp_class": "negative"
        },
        {
          "field": "Operating Profit Margin (Excl OI)",
          "val1": "0.44%",
          "val2": "1.02%",
          "chgp": "-0.58%",
          "chgp_class": "negative"
        }
      ]
    }
  }
]

Quarterly Results Snapshot (Consolidated) - Jun'26 - YoYstock-summary

Jun'26
Jun'25
Change(%)
Net Sales
14,969.51
12,821.65
16.75%
Operating Profit (PBDIT) excl Other Income
166.85
118.59
40.69%
Interest
35.53
19.68
80.54%
Exceptional Items
0.00
-0.53
100.00%
Consolidate Net Profit
95.56
69.64
37.22%
Operating Profit Margin (Excl OI)
1.11%
0.92%
0.19%
Values in Rs Cr.
Direction Arrows
Net Sales

YoY Growth in quarter ended Jun 2026 is 16.75% vs 8.67% in Jun 2025

Direction Arrows
Consolidated Net Profit

YoY Growth in quarter ended Jun 2026 is 37.22% vs -45.29% in Jun 2025

Half Yearly Results Snapshot (Consolidated) - Sep'25stock-summary

Sep'25
Sep'24
Change(%)
Net Sales
22,613.24
25,170.47
-10.16%
Operating Profit (PBDIT) excl Other Income
139.60
363.40
-61.59%
Interest
40.80
21.83
86.90%
Exceptional Items
-0.57
-1.22
53.28%
Consolidate Net Profit
73.76
239.85
-69.25%
Operating Profit Margin (Excl OI)
0.62%
1.44%
-0.82%
Values in Rs Cr.
Direction Arrows
Net Sales

Growth in half year ended Sep 2025 is -10.16% vs 30.20% in Sep 2024

Direction Arrows
Consolidated Net Profit

Growth in half year ended Sep 2025 is -69.25% vs 1.82% in Sep 2024

Nine Monthly Results Snapshot (Consolidated) - Dec'25stock-summary

Dec'25
Dec'24
Change(%)
Net Sales
36,872.17
34,093.14
8.15%
Operating Profit (PBDIT) excl Other Income
217.61
442.00
-50.77%
Interest
76.73
32.06
139.33%
Exceptional Items
-0.56
-1.41
60.28%
Consolidate Net Profit
110.32
295.89
-62.72%
Operating Profit Margin (Excl OI)
0.59%
1.30%
-0.71%
Values in Rs Cr.
Direction Arrows
Net Sales

YoY Growth in nine months ended Dec 2025 is 8.15% vs 7.59% in Dec 2024

Direction Arrows
Consolidated Net Profit

YoY Growth in nine months ended Dec 2025 is -62.72% vs -22.97% in Dec 2024

Annual Results Snapshot (Consolidated) - Mar'26stock-summary

Mar'26
Mar'25
Change(%)
Net Sales
47,674.11
46,468.91
2.59%
Operating Profit (PBDIT) excl Other Income
211.62
472.00
-55.17%
Interest
111.86
47.36
136.19%
Exceptional Items
1.12
-3.36
133.33%
Consolidate Net Profit
83.97
327.21
-74.34%
Operating Profit Margin (Excl OI)
0.44%
1.02%
-0.58%
Values in Rs Cr.
Direction Arrows
Net Sales

YoY Growth in year ended Mar 2026 is 2.59% vs -0.23% in Mar 2025

Direction Arrows
Consolidated Net Profit

YoY Growth in year ended Mar 2026 is -74.34% vs -3.78% in Mar 2025

stock-summaryCompany CV
About Max Financial Services Ltd stock-summary
stock-summary
Max Financial Services Ltd
Mid Cap
Insurance
Max Financial Services Limited was erstwhile incorporated as 'Max India Limited' on February 24, 1988, which subsequently was changed to Max Financial Services Limited on January 15, 2016. The Company, a part of the $5 billion Max Group, is the holding company for Max Life Insurance Company Limited. The Company owns and actively manages an 80.98% majority stake in Max Life Insurance , India's largest non-bank owned, private life insurance company.
Company Coordinates stock-summary
Company Details
Bhai Mohan Singh Nagar, Railmajra Tehsil Balachaur Nawanshahr Punjab : 144533
stock-summary
Tel: 91-01881-462000
stock-summary
investorhelpline@maxindia.com
Registrar Details
MAS Services Ltd, T-34 , 2nd Floor, Okhla Industrial Area, Phase - II, New Delhi