
Compare Mcleod Russel with Similar Stocks
Dashboard
With a Negative Book Value, the company has a Weak Long Term Fundamental Strength
- Low ability to service debt as the company has a high Debt to EBITDA ratio of -57.74 times
- The company has reported losses and also has negative networth. This is not a good sign for the investors. Either company will have to raise fresh capital or report profits to sustain going forward
Risky - Negative EBITDA
Despite the size of the company, domestic mutual funds hold only 0% of the company
Total Returns (Price + Dividend) 
Latest dividend: 0.5 per share ex-dividend date: Aug-01-2018
Risk Adjusted Returns v/s
Returns Beta

News

Mcleod Russel India Ltd is Rated Sell
Mcleod Russel India Ltd is rated 'Sell' by MarketsMOJO, with this rating last updated on 06 May 2026. However, the analysis and financial metrics discussed here reflect the company’s current position as of 26 June 2026, providing investors with the latest insights into its performance and outlook.
Read full news article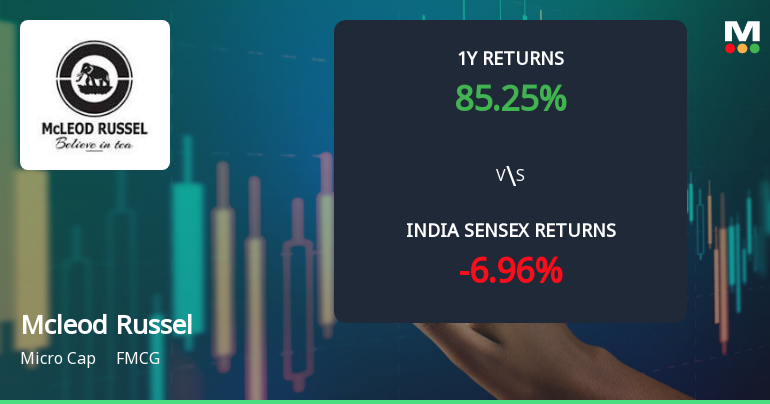
Mcleod Russel India Ltd Technical Momentum Shifts Amid Mixed Market Signals
Mcleod Russel India Ltd, a micro-cap player in the FMCG sector, has experienced a nuanced shift in its technical parameters, reflecting a complex interplay of bullish and bearish signals. Despite a recent downgrade in its Mojo Grade from Strong Sell to Sell, the stock’s price momentum and technical indicators suggest a cautiously optimistic outlook amid ongoing volatility.
Read full news article
Mcleod Russel India Ltd is Rated Sell by MarketsMOJO
Mcleod Russel India Ltd is rated 'Sell' by MarketsMOJO, with this rating last updated on 06 May 2026. However, the analysis and financial metrics discussed here reflect the stock's current position as of 13 June 2026, providing investors with an up-to-date view of the company’s fundamentals, valuation, financial trends, and technical outlook.
Read full news article Announcements
Announcement under Regulation 30 (LODR)-Newspaper Publication
17-Jun-2026 | Source : BSEPlease find enclosed herewith copies of Newspaper Advertisement published on 17th June 2026 regarding opening of a special window for re-lodgement of transfer and dematerialisation of physical shares.
Announcement under Regulation 30 (LODR)-Newspaper Publication
30-May-2026 | Source : BSENewspaper Publication dated 30.05.2026
Financial Results For The Quarter And Year Ended 31.03.2026
29-May-2026 | Source : BSEFinancial Results for the Quarter and Year ended 31.03.2026
Corporate Actions

No Upcoming Board Meetings

Mcleod Russel India Ltd has declared 10% dividend, ex-date: 01 Aug 18

No Splits history available

No Bonus history available

No Rights history available
Quality key factors
Valuation key factors
Technicals key factors
 Technical Indicator Scale: Bearish, Mildly Bearish, Sideways, Mildly Bullish, Bullish Turned
 Shareholding Snapshot : Mar 2026
Shareholding Compare (%holding)
Non Institution
0.0571
Held by 2 Schemes (0.0%)
Held by 5 FIIs (1.84%)
Kavita Khaitan . (3.83%)
Santosh Kr Kejriwal Securities Private Limited (2.67%)
69.68%
Quarterly Results Snapshot (Consolidated) - Mar'26 - YoY

YoY Growth in quarter ended Mar 2026 is -21.22% vs -15.12% in Mar 2025

YoY Growth in quarter ended Mar 2026 is 58.33% vs 20.15% in Mar 2025
Half Yearly Results Snapshot (Consolidated) - Sep'25
Growth in half year ended Sep 2025 is -10.90% vs 9.63% in Sep 2024
Growth in half year ended Sep 2025 is -122.57% vs 655.65% in Sep 2024
Nine Monthly Results Snapshot (Consolidated) - Dec'25
YoY Growth in nine months ended Dec 2025 is 0.40% vs 8.40% in Dec 2024
YoY Growth in nine months ended Dec 2025 is -116.94% vs 74.85% in Dec 2024
Annual Results Snapshot (Consolidated) - Mar'26
YoY Growth in year ended Mar 2026 is -2.62% vs 4.36% in Mar 2025
YoY Growth in year ended Mar 2026 is 37.59% vs 36.50% in Mar 2025
About Mcleod Russel India Ltd

Company Coordinates


