
Compare Medi Assist Ser. with Similar Stocks
Total Returns (Price + Dividend) 
Latest dividend: 4 per share ex-dividend date: Sep-06-2024
Risk Adjusted Returns v/s
Returns Beta

News
Medi Assist Healthcare Services Ltd is Rated Sell
Medi Assist Healthcare Services Ltd is rated 'Sell' by MarketsMOJO, with this rating last updated on 09 May 2026. However, the analysis and financial metrics discussed here reflect the stock's current position as of 17 May 2026, providing investors with the latest insights into its performance and outlook.
Read full news article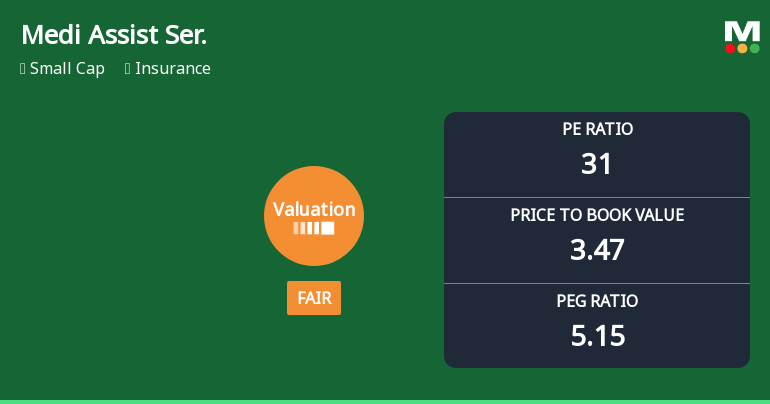
Medi Assist Healthcare Services Ltd: Valuation Shifts Signal Improved Price Attractiveness
Medi Assist Healthcare Services Ltd has witnessed a notable shift in its valuation parameters, moving from an expensive to a fair valuation grade. This change, coupled with recent price movements and comparative sector analysis, suggests a recalibration of price attractiveness for investors in the insurance sector.
Read full news articleAre Medi Assist Healthcare Services Ltd latest results good or bad?
Medi Assist Healthcare Services Ltd reported its financial results for Q4 FY26, showcasing a complex picture of growth and operational challenges. The company achieved net sales of ₹241.99 crores, reflecting a modest sequential growth of 0.96% from the previous quarter and a significant year-on-year increase of 28.13%. This topline growth indicates the company's ongoing penetration in the health insurance intermediary market, driven by rising health insurance adoption and corporate wellness program expansions. However, the operational efficiency of the company has come under scrutiny. The operating margin for Q4 FY26 was reported at 19.94%, down from 21.57% in the same quarter last year, indicating a contraction in profitability. This decline is primarily attributed to a substantial rise in employee costs, which surged by 33.49% year-on-year, outpacing revenue growth. The extraordinary net profit of ₹53.44...
Read full news article Announcements
Update On Merger Of Wholly-Owned Subsidiaries Of The Company
20-May-2026 | Source : BSEAs enclosed
Announcement under Regulation 30 (LODR)-Earnings Call Transcript
15-May-2026 | Source : BSEAs enclosed
Announcement under Regulation 30 (LODR)-Analyst / Investor Meet - Outcome
12-May-2026 | Source : BSEAs enclosed
Corporate Actions

No Upcoming Board Meetings

Medi Assist Healthcare Services Ltd has declared 80% dividend, ex-date: 06 Sep 24

No Splits history available

No Bonus history available

No Rights history available
Quality key factors
Valuation key factors
Technicals key factors
 Technical Indicator Scale: Bearish, Mildly Bearish, Sideways, Mildly Bullish, Bullish Turned
 Shareholding Snapshot : Mar 2026
Shareholding Compare (%holding)
Mutual Funds
None
Held by 12 Schemes (36.39%)
Held by 62 FIIs (24.32%)
Medimatter Health Management Private Limited (4.62%)
Hdfc Large And Mid Cap Fund (8.8%)
14.1%
Quarterly Results Snapshot (Consolidated) - Mar'26 - QoQ

QoQ Growth in quarter ended Mar 2026 is 0.96% vs 3.07% in Dec 2025

QoQ Growth in quarter ended Mar 2026 is 1,181.53% vs -47.55% in Dec 2025
Half Yearly Results Snapshot (Consolidated) - Sep'25
Growth in half year ended Sep 2025 is 21.41% vs 15.41% in Sep 2024
Growth in half year ended Sep 2025 is -23.88% vs 86.79% in Sep 2024
Nine Monthly Results Snapshot (Consolidated) - Dec'25
YoY Growth in nine months ended Dec 2025 is 24.01% vs -1.75% in Dec 2024
YoY Growth in nine months ended Dec 2025 is -50.27% vs -7.21% in Dec 2024
Annual Results Snapshot (Consolidated) - Mar'26
YoY Growth in year ended Mar 2026 is 25.09% vs 13.96% in Mar 2025
YoY Growth in year ended Mar 2026 is -3.29% vs 35.76% in Mar 2025
About Medi Assist Healthcare Services Ltd

Company Coordinates


