Menon Bearings

  • Market Cap: Micro Cap
  • Industry: Auto Components & Equipments
  • ISIN: INE071D01033
  • NSEID: MENONBE
  • BSEID: 523828
INR
198.30
9.4 (4.98%)
BSENSE

Jul 17, 03:30 PM

BSE+NSE Vol: 2.44 lacs

  • Price Points
  • Score
  • Mojo Parameters
  • Total Return
  • News and Corporate Actions
  • Key factors
  • Shareholding
  • Financials
  • CompanyCV
stock-summaryPrice Point
High/Low

1Day

52 Week

Valuation
Technical
Day's Volume

CASH

2.44 lacs (75.84%) Volume

Shareholding (Mar 2026)

FII

0.21%

Held by 2 FIIs

DII

0.03%

Held by 0 DIIs

Promoter

68.44%

Why is Menon Bearings Ltd falling/rising?

19-Jul-2026

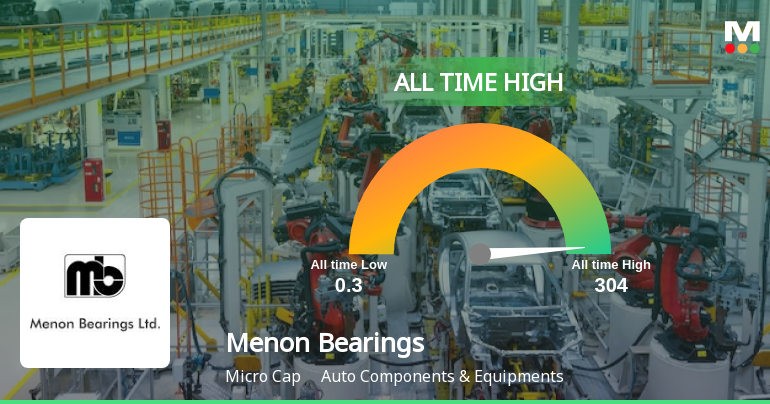
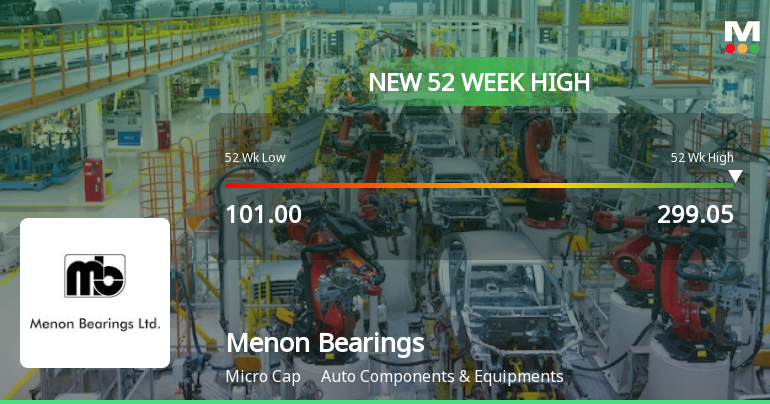
As of 18-Jul, Menon Bearings Ltd's stock price has risen to Rs. 198.30, reflecting a 4.98% increase. This growth is driven by strong year-to-date performance, reaching a new all-time high, and increased investor interest, significantly outperforming the Sensex.

As of 18-Jul, Menon Bearings Ltd is experiencing a rise in its stock price, currently at Rs. 198.30, which reflects an increase of Rs. 9.4 or 4.98%. This upward movement can be attributed to several factors. <BR><BR>Firstly, the stock has shown strong performance over various periods, with a year-to-date increase of 85.59%, significantly outperforming the Sensex, which has declined by 8.30% during the same timeframe. Additionally, the stock has gained 15.66% over the past week, compared to a modest 0.75% increase in the Sensex.<BR><BR>Today, the stock reached a new 52-week and all-time high of Rs. 198.30, indicating strong investor confidence. It has also outperformed its sector by 5.25% today, suggesting that it is attracting positive attention from investors. The stock opened with a gain of 4.92% today and has been on a consecutive gain streak for the last three days, accumulating a total return of 10.75% in that period.<BR><BR>Moreover, Menon Bearings Ltd is trading above its moving averages across various time frames, including the 5-day, 20-day, 50-day, 100-day, and 200-day averages, which is often seen as a bullish signal. The rising investor participation is also notable, with delivery volume increasing by 36.26% against the 5-day average, indicating heightened interest in the stock. <BR><BR>Overall, these factors contribute to the rising stock price of Menon Bearings Ltd.

View full answer

Which are the latest news on Menon Bearings?

18-Jul-2026

Are Menon Bearings Ltd latest results good or bad?

17-Jul-2026

Menon Bearings Ltd's latest Q1 FY27 results are strong, with a net profit increase of 67.38% year-on-year and revenue growth of 36.57%. The company shows effective capital utilization with a return on equity of 20.64%, reflecting strong investor confidence and robust stock performance.

Menon Bearings Ltd's latest results for Q1 FY27 are quite strong, reflecting a positive performance overall. The company reported a net profit of ₹14.11 crores, which is a remarkable increase of 67.38% year-on-year. Additionally, revenue reached ₹91.79 crores, marking a substantial growth of 36.57% compared to the same quarter last year and a 5.29% increase from the previous quarter.<BR><BR>The operating margin stood at 21.92%, which, while slightly lower than the previous quarter's margin, is still significantly improved from the prior year. The return on equity (ROE) is also impressive at 20.64%, indicating effective capital utilization.<BR><BR>Overall, these results highlight Menon Bearings' ability to capitalize on strong demand in its core markets, particularly in the commercial vehicle and heavy-duty diesel engine segments. The company's stock performance has been robust, with a year-to-date increase of 76.79%, significantly outperforming broader market indices. This indicates strong investor confidence in the company's growth trajectory and operational execution.

View full answer

Has Menon Bearings Ltd declared dividend?

17-Jul-2026

Menon Bearings Ltd has declared a 200% dividend, with an ex-date of July 22, 2026. The company has shown strong total returns across various periods, with a 5-year total return of 163.47%.

Menon Bearings Ltd has declared a 200% dividend.<BR><BR>Dividend Details:<BR>- Percentage announced: 200%<BR>- Ex-date: 22 Jul 26<BR><BR>Dividend Yield: 1.06%.<BR><BR>Total Returns by Period:<BR>In the last 3 months, the price return was 57.51%, the dividend return was 1.63%, resulting in a total return of 59.14%.<BR><BR>Over the past 6 months, the price return stood at 51.72%, with a dividend return of 1.58%, leading to a total return of 53.3%.<BR><BR>For the 1-year period, the price return was 58.45%, the dividend return was 3.16%, culminating in a total return of 61.61%.<BR><BR>In the 2-year span, the price return was 45.49%, the dividend return was 3.01%, which resulted in a total return of 48.5%.<BR><BR>Over the last 3 years, the price return reached 50.17%, with a dividend return of 4.39%, giving a total return of 54.56%.<BR><BR>In the 4-year period, the price return was 137.49%, the dividend return was 9.17%, resulting in a total return of 146.66%.<BR><BR>Finally, in the 5-year timeframe, the price return was 148.03%, with a dividend return of 15.44%, leading to a total return of 163.47%.<BR><BR>Overall, Menon Bearings Ltd has declared a substantial dividend, and the total returns over various periods indicate strong performance, particularly in the longer term, suggesting a favorable investment outlook.

View full answer

When is the next results date for Menon Bearings Ltd?

09-Jul-2026

The next results date for Menon Bearings Ltd is 16 July 2026.

The next results date for Menon Bearings Ltd is scheduled for 16 July 2026.

View full answer

How big is Menon Bearings?

11-Jun-2026

Summary could not be generated.

As of 10th June, Menon Bearings Ltd has a market capitalization of 993.00 Cr, classified as a Micro Cap.<BR><BR>In the latest four quarters, Menon Bearings reported net sales of 293.81 Cr and a net profit of 38.25 Cr.<BR><BR>The reporting period for the balance sheet data is the latest annual period. However, specific values for Shareholder's Funds and Total Assets are unavailable.

View full answer

Who are in the management team of Menon Bearings?

11-Jun-2026

The management team of Menon Bearings includes Nitin Menon (Chairman, Executive Director & CEO), R D Dixit (Managing Director), Arun Aradhye (Whole Time Director & CFO), and several independent directors: M L Shinde, Kailash A Nevagi, and Santosh Prabhu, along with Manmay Kalyankar (Company Secretary & Compliance Officer).

The management team of Menon Bearings includes the following key individuals:<BR><BR>1. **Nitin Menon** - Chairman, Executive Director & CEO<BR>2. **R D Dixit** - Managing Director<BR>3. **Arun Aradhye** - Whole Time Director & Chief Financial Officer<BR>4. **M L Shinde** - Independent Non-Executive Director<BR>5. **Kailash A Nevagi** - Independent Non-Executive Director<BR>6. **Santosh Prabhu** - Independent Non-Executive Director<BR>7. **Manmay Kalyankar** - Company Secretary & Compliance Officer<BR><BR>These individuals play significant roles in the company's leadership and governance.

View full answer

Who are the peers of the Menon Bearings?

11-Jun-2026

Menon Bearings' peers include Saint-Gob. Sekur, The Hi-Tech Gear, Alicon Cast., Munjal Auto Inds, and others. In terms of management risk, growth, and capital structure, they vary from excellent to below average, with Menon Bearings showing a 1-year return of 32.79%.

Peers: The peers of Menon Bearings are Saint-Gob. Sekur, The Hi-Tech Gear, Alicon Cast., Munjal Auto Inds, Pradeep Metals, Automotive Stamp, IST, Sterling Tools, Enkei Wheels, and GKW.<BR><BR>Quality Snapshot: Excellent management risk is observed at Alicon Cast., while Average management risk is found at Saint-Gob. Sekur, The Hi-Tech Gear, Munjal Auto Inds, Menon Bearings, Pradeep Metals, and Automotive Stamp, and the rest. Below Average management risk is seen at IST, Sterling Tools, Enkei Wheels, and GKW. Growth is rated as Excellent for Enkei Wheels, Good for Saint-Gob. Sekur and Automotive Stamp, Average for Alicon Cast., Menon Bearings, Pradeep Metals, and Munjal Auto Inds, and Below Average for The Hi-Tech Gear and Sterling Tools, and the rest. Capital Structure is rated as Excellent for Saint-Gob. Sekur and IST, Good for Munjal Auto Inds and Menon Bearings, and Average for The Hi-Tech Gear, Alicon Cast., Pradeep Metals, Automotive Stamp, and the rest, while Below Average is noted for Enkei Wheels and GKW.<BR><BR>Return Snapshot: Pradeep Metals has the highest 1-year return at 89.63%, while The Hi-Tech Gear has the lowest at -27.41%. Menon Bearings' 1-year return of 32.79% is significantly higher than The Hi-Tech Gear's. Additionally, the six-month returns are negative for The Hi-Tech Gear, Alicon Cast., IST, Sterling Tools, Enkei Wheels, and GKW.

View full answer

What does Menon Bearings do?

10-Jun-2026

Menon Bearings Ltd manufactures critical engine components like bearings and thrust washers for heavy-duty diesel engines and multi-axle vehicles. As of March 2026, it reported net sales of 87 Cr and a net profit of 14 Cr, with a market cap of INR 993 Cr.

Overview: <BR>Menon Bearings Ltd is engaged in the manufacturing of critical engine components such as bearings, bushes, and thrust washers for heavy-duty diesel engines and multi-axle vehicles, operating within the Auto Components & Equipments industry and classified as a Micro Cap company.<BR><BR>History: <BR>Incorporated as a public limited company on 4 July 1991, Menon Bearings commenced business on 23 September 1991. The latest reported quarterly results indicate net sales and net profit for the period ending March 2026.<BR><BR>Financial Snapshot: <BR>Net Sales: 87 Cr (Quarterly Results - Mar 2026) <BR>Net Profit: 14 Cr (Quarterly Results - Mar 2026) <BR>Market Cap: INR 993 Cr (Micro Cap)<BR><BR>Key Metrics: <BR>P/E: 24.00 <BR>Industry P/E: 36 <BR>Dividend Yield: 1.18% <BR>Debt-Equity: 0.18 <BR>Return on Equity: 20.64% <BR>Price to Book: 5.14<BR><BR>Contact Details: <BR>Address: G-I MIDC, Gokul-Shrigaon Kolhapur Maharashtra : 416234 <BR>Tel: 91-231-2672279/533/487 <BR>Email: admin@menonbearing.in <BR>Website: http://www.menonbearings.com

View full answer

Should I buy, sell or hold Menon Bearings Ltd?

15-May-2026

Is Menon Bearings technically bullish or bearish?

02-Dec-2025

As of December 1, 2025, Menon Bearings is in a mildly bearish trend due to bearish signals from the MACD and Bollinger Bands on longer time frames, despite some mildly bullish daily moving averages.

As of 1 December 2025, the technical trend for Menon Bearings has changed from sideways to mildly bearish. The current stance is mildly bearish, driven primarily by the bearish signals from the MACD and Bollinger Bands on both weekly and monthly time frames. The Dow Theory also indicates a mildly bearish trend on both weekly and monthly levels. While the daily moving averages show a mildly bullish signal, this is outweighed by the overall bearish indicators in the longer time frames. The RSI shows no signal, indicating a lack of momentum in either direction. Overall, the technical indicators suggest a cautious outlook for Menon Bearings.

View full answer

How has been the historical performance of Menon Bearings?

28-Oct-2025

Menon Bearings has shown steady growth in net sales and profits, with net sales increasing from 210.75 Cr in Mar'24 to 239.28 Cr in Mar'25, despite rising expenditures impacting profit margins. Profit after tax rose from 24.36 Cr to 24.93 Cr, while cash flow from investing activities worsened.

Answer:<BR>The historical performance of Menon Bearings shows a steady growth in net sales and profits over the years, with a notable increase in recent years.<BR><BR>Breakdown:<BR>Menon Bearings has demonstrated a consistent upward trend in net sales, rising from 210.75 Cr in Mar'24 to 239.28 Cr in Mar'25, following a slight decrease from 216.94 Cr in Mar'23. The total operating income mirrored this trend, reaching 239.28 Cr in Mar'25. However, total expenditure also increased, from 169.31 Cr in Mar'24 to 197.36 Cr in Mar'25, which impacted the operating profit, which slightly improved from 41.44 Cr in Mar'24 to 41.92 Cr in Mar'25. Profit before tax showed a modest increase from 33.14 Cr in Mar'24 to 33.84 Cr in Mar'25, while profit after tax rose from 24.36 Cr to 24.93 Cr in the same period. The earnings per share (EPS) increased from 4.35 in Mar'24 to 4.45 in Mar'25, although it was lower than the 5.82 recorded in Mar'23. The operating profit margin decreased from 19.66% in Mar'24 to 17.52% in Mar'25, and the profit after tax margin also fell from 11.56% to 10.42%. Cash flow from operating activities remained stable at 27.00 Cr in Mar'25, while cash flow from investing activities showed a negative trend, increasing outflows from -19.00 Cr in Mar'24 to -26.00 Cr in Mar'25. Overall, Menon Bearings has shown resilience and growth in its financial performance despite some fluctuations in profit margins and cash flow dynamics.

View full answer

Is Menon Bearings overvalued or undervalued?

26-Sep-2025

As of September 25, 2025, Menon Bearings is fairly valued with a PE ratio of 26.84, an EV to EBITDA of 17.04, and a ROCE of 18.26%, outperforming the Sensex with a YTD return of 9.50%.

As of 25 September 2025, the valuation grade for Menon Bearings has moved from expensive to fair. The company is currently fairly valued based on its financial metrics. Key ratios include a PE ratio of 26.84, an EV to EBITDA of 17.04, and a ROCE of 18.26%. <BR><BR>In comparison to its peers, Menon Bearings' PE ratio is lower than Bosch's 50.97 and significantly higher than TVS Holdings' 20.9, indicating a more reasonable valuation within the auto components sector. Additionally, the company has shown a strong performance with a YTD return of 9.50%, outperforming the Sensex's 3.87% during the same period.

View full answer

Who are the top shareholders of the Menon Bearings?

17-Jul-2025

The top shareholder of Menon Bearings is Nitin Ram Menon, who holds 27.56% of the shares. Promoters own the majority, with individual investors at 25.0% and foreign institutional investors holding 0.46%, while no mutual funds currently have shares in the company.

The top shareholders of Menon Bearings primarily consist of the promoters, with Nitin Ram Menon holding the largest share at 27.56%. There are no pledged promoter holdings, and individual investors collectively hold 25.0% of the shares. Additionally, the company has three foreign institutional investors (FIIs) that hold a combined 0.46%. There are no mutual funds currently holding shares in the company.

View full answer

What is the bonus history of the Menon Bearings?

06-Jun-2025

Menon Bearings issued a 1:5 bonus on August 30, 2016, with a record date of August 31, 2016, meaning shareholders received one additional share for every five shares held.

Menon Bearings has a bonus history that includes a 1:5 bonus issue announced on August 30, 2016. The record date for this bonus was August 31, 2016. This means that shareholders received one additional share for every five shares they held as of the record date. If you need more details or have further questions about the company, feel free to ask!

View full answer
iScoreScore
Click here to find our call on this stock
Strong Sell
Sell
Hold
Buy
Strong Buy

Dashboard

1

Strong ability to service debt as the company has a low Debt to EBITDA ratio of 0.79 times

 
2

Healthy long term growth as Operating profit has grown by an annual rate 33.01%

 
3

Positive results in Jun 26

4

With ROCE of 22.2, it has a Expensive valuation with a 5.2 Enterprise value to Capital Employed

5

Despite the size of the company, domestic mutual funds hold only 0% of the company

6

Market Beating performance in long term as well as near term

stock-summaryMojo Parameters

Mojo Parameters

Loading Valuation Snapshot...

Stock DNA

stock-summary
Industry

Auto Components & Equipments

stock-summary
Market cap

INR 1,111 Cr (Micro Cap)

stock-summary
P/E

25.00

stock-summary
Industry P/E

38

stock-summary
Dividend Yield

1.06%

stock-summary
Debt Equity

0.18

stock-summary
Return on Equity

20.64%

stock-summary
Price to Book

5.71

Revenue and Profits:
Net Sales:
92 Cr
(Quarterly Results - Jun 2026)
Net Profit:
14 Cr
stock-summaryTotal Returns
Total Returns (Price + Dividend) stock-summary
Dividend Yield (1.06%)
TimePeriod
Price Return
Dividend Return
Total Return
3 Months
57.51%
1.63%
59.14%
6 Months
51.72%
1.65%
53.37%
1 Year
58.45%
3.26%
61.71%
2 Years
45.49%
3.01%
48.5%
3 Years
50.17%
4.46%
54.63%
4 Years
137.49%
9.33%
146.82%
5 Years
148.03%
16.23%
164.26%

Latest dividend: 2 per share ex-dividend date: Jul-31-2025

Risk Adjusted Returns v/s stock-summary
Returns Beta
Icon
Beta has not been calculated since enough price history is not available
stock-summaryNews & Corporate Actions

News

Menon Bearings Ltd Gains 15.66%: 5 Key Factors Driving the Week’s Rally

Key Events This Week

13 Jul: Stock surged to upper circuit amid robust buying pressure

14 Jul: New 52-week and all-time high at Rs.186.80

16 Jul: Volatile day with both new highs and lower circuit hit

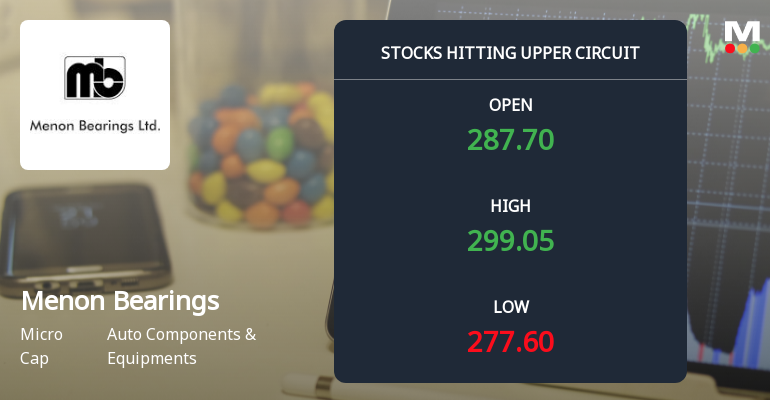
17 Jul: New 52-week high at Rs.198.30 and upper circuit hit

Announcements stock-summary

Announcement under Regulation 30 (LODR)-Analyst / Investor Meet - Outcome

17-Jul-2026 | Source : BSE

Outcome of Schedule of Analyst / Institutional Investor Meeting -Earning Call Recordings

Announcement under Regulation 30 (LODR)-Newspaper Publication

17-Jul-2026 | Source : BSE

Submission of copies of newspaper advertisement for UFR (Standalone & Consolidated) for the quarter ended June 30 2026

Un-Audited Financial Results For Quarter Ended 30Th June 2026

16-Jul-2026 | Source : BSE

Un-audited Financial results for quarter ended 30th June 2026

Corporate Actions stock-summary

stock-summary
BOARD MEETING

No Upcoming Board Meetings

stock-summary
DIVIDEND

Menon Bearings Ltd has declared 200% dividend, ex-date: 22 Jul 26

stock-summary
SPLITS

Menon Bearings Ltd has announced 1:5 stock split, ex-date: 09 Apr 15

stock-summary
BONUS

Menon Bearings Ltd has announced 1:5 bonus issue, ex-date: 30 Aug 16

stock-summary
RIGHTS

No Rights history available

stock-summaryKey Factors

Quality key factors stock-summary

Factor
Value
Sales Growth (5y)
22.11%
EBIT Growth (5y)
33.01%
EBIT to Interest (avg)
10.43
Debt to EBITDA (avg)
0.87
Net Debt to Equity (avg)
0.18
Sales to Capital Employed (avg)
1.14
Tax Ratio
23.72%
Dividend Payout Ratio
44.95%
Pledged Shares
0
Institutional Holding
0.24%
ROCE (avg)
20.70%
ROE (avg)
17.71%

Valuation key factors

Factor
Value
P/E Ratio
25
Industry P/E
38
Price to Book Value
6.00
EV to EBIT
20.62
EV to EBITDA
17.36
EV to Capital Employed
5.22
EV to Sales
3.60
PEG Ratio
0.41
Dividend Yield
1.01%
ROCE (Latest)
22.24%
ROE (Latest)
20.64%

Technicals key factors

Indicator
Weekly
Monthly
MACD
Bullish
Bullish
RSI
No Signal
No Signal
Bollinger Bands
Bullish
Bullish
Moving Averages
Bullish (Daily)
KST
Bullish
Bullish
Dow Theory
Bullish
Bullish
OBV
Mildly Bullish
No Trend
stock-summary Technical Indicator Scale: Bearish, Mildly Bearish, Sideways, Mildly Bullish, Bullish  Turned 
stock-summaryShareholding
Shareholding Snapshot : Mar 2026stock-summary
Shareholding Compare (%holding) stock-summary
Majority shareholders

Promoters

Pledged Promoter Holdings

None

Mutual Funds

Held by 0 Schemes

FIIs

Held by 2 FIIs (0.21%)

Promoter with highest holding

Nitin R Menon (27.56%)

Highest Public shareholder

None

Individual Investors Holdings

24.87%

stock-summaryFinancial
[
  {
    "link": "quarterly",
    "btn_text": "All Quarterly Results",
    "header": "Quarterly Results Snapshot (Consolidated) - Jun'26 - QoQ",
    "rhs": [
      {
        "prefix": "Net Sales ",
        "suffix": "QoQ Growth in quarter ended Jun 2026 is 5.29% vs 13.35% in Mar 2026",
        "dir": -1
      },
      {
        "prefix": "Consolidated Net Profit ",
        "suffix": "QoQ Growth in quarter ended Jun 2026 is 2.39% vs 48.97% in Mar 2026",
        "dir": -1
      }
    ],
    "table": {
      "header": [
        "Jun'26",
        "Mar'26",
        "Change(%)"
      ],
      "body": [
        {
          "field": "Net Sales",
          "val1": "91.79",
          "val2": "87.18",
          "chgp": "5.29%",
          "chgp_class": "positive"
        },
        {
          "field": "Operating Profit (PBDIT) excl Other Income",
          "val1": "20.12",
          "val2": "21.61",
          "chgp": "-6.89%",
          "chgp_class": "negative"
        },
        {
          "field": "Interest",
          "val1": "1.37",
          "val2": "1.40",
          "chgp": "-2.14%",
          "chgp_class": "positive"
        },
        {
          "field": "Exceptional Items",
          "val1": "0.00",
          "val2": "0.00",
          "chgp": "",
          "chgp_class": "neutral"
        },
        {
          "field": "Consolidate Net Profit",
          "val1": "14.11",
          "val2": "13.78",
          "chgp": "2.39%",
          "chgp_class": "positive"
        },
        {
          "field": "Operating Profit Margin (Excl OI)",
          "val1": "21.92%",
          "val2": "24.79%",
          "chgp": "-2.87%",
          "chgp_class": "negative"
        }
      ]
    }
  },
  {
    "link": "half-yearly",
    "btn_text": "All Half Yearly Results",
    "header": "Half Yearly Results Snapshot (Consolidated) - Sep'25",
    "rhs": [
      {
        "prefix": "Net Sales ",
        "suffix": " Growth in half year ended Sep 2025 is 10.80% vs 10.83% in Sep 2024",
        "dir": -1
      },
      {
        "prefix": "Consolidated Net Profit ",
        "suffix": " Growth in half year ended Sep 2025 is 18.35% vs -2.58% in Sep 2024",
        "dir": 1
      }
    ],
    "table": {
      "header": [
        "Sep'25",
        "Sep'24",
        "Change(%)"
      ],
      "body": [
        {
          "field": "Net Sales",
          "val1": "129.72",
          "val2": "117.08",
          "chgp": "10.80%",
          "chgp_class": "positive"
        },
        {
          "field": "Operating Profit (PBDIT) excl Other Income",
          "val1": "22.70",
          "val2": "22.16",
          "chgp": "2.44%",
          "chgp_class": "positive"
        },
        {
          "field": "Interest",
          "val1": "2.34",
          "val2": "2.01",
          "chgp": "16.42%",
          "chgp_class": "negative"
        },
        {
          "field": "Exceptional Items",
          "val1": "0.00",
          "val2": "0.00",
          "chgp": "",
          "chgp_class": "neutral"
        },
        {
          "field": "Consolidate Net Profit",
          "val1": "15.22",
          "val2": "12.86",
          "chgp": "18.35%",
          "chgp_class": "positive"
        },
        {
          "field": "Operating Profit Margin (Excl OI)",
          "val1": "17.50%",
          "val2": "18.93%",
          "chgp": "-1.43%",
          "chgp_class": "negative"
        }
      ]
    }
  },
  {
    "link": "nine-monthly",
    "btn_text": "All Nine Monthly Results",
    "header": "Nine Monthly Results Snapshot (Consolidated) - Dec'25",
    "rhs": [
      {
        "prefix": "Net Sales ",
        "suffix": "YoY Growth in nine months ended Dec 2025 is 17.76% vs 11.67% in Dec 2024",
        "dir": 1
      },
      {
        "prefix": "Consolidated Net Profit ",
        "suffix": "YoY Growth in nine months ended Dec 2025 is 33.50% vs -1.82% in Dec 2024",
        "dir": 1
      }
    ],
    "table": {
      "header": [
        "Dec'25",
        "Dec'24",
        "Change(%)"
      ],
      "body": [
        {
          "field": "Net Sales",
          "val1": "206.63",
          "val2": "175.47",
          "chgp": "17.76%",
          "chgp_class": "positive"
        },
        {
          "field": "Operating Profit (PBDIT) excl Other Income",
          "val1": "37.16",
          "val2": "31.91",
          "chgp": "16.45%",
          "chgp_class": "positive"
        },
        {
          "field": "Interest",
          "val1": "3.68",
          "val2": "3.24",
          "chgp": "13.58%",
          "chgp_class": "negative"
        },
        {
          "field": "Exceptional Items",
          "val1": "0.00",
          "val2": "0.00",
          "chgp": "",
          "chgp_class": "neutral"
        },
        {
          "field": "Consolidate Net Profit",
          "val1": "24.47",
          "val2": "18.33",
          "chgp": "33.50%",
          "chgp_class": "positive"
        },
        {
          "field": "Operating Profit Margin (Excl OI)",
          "val1": "17.98%",
          "val2": "18.19%",
          "chgp": "-0.21%",
          "chgp_class": "negative"
        }
      ]
    }
  },
  {
    "link": "annual",
    "btn_text": "All Annual Results",
    "header": "Annual Results Snapshot (Consolidated) - Mar'26",
    "rhs": [
      {
        "prefix": "Net Sales ",
        "suffix": "YoY Growth in year ended Mar 2026 is 22.79% vs 13.54% in Mar 2025",
        "dir": 1
      },
      {
        "prefix": "Consolidated Net Profit ",
        "suffix": "YoY Growth in year ended Mar 2026 is 53.43% vs 2.34% in Mar 2025",
        "dir": 1
      }
    ],
    "table": {
      "header": [
        "Mar'26",
        "Mar'25",
        "Change(%)"
      ],
      "body": [
        {
          "field": "Net Sales",
          "val1": "293.81",
          "val2": "239.28",
          "chgp": "22.79%",
          "chgp_class": "positive"
        },
        {
          "field": "Operating Profit (PBDIT) excl Other Income",
          "val1": "58.78",
          "val2": "41.92",
          "chgp": "40.22%",
          "chgp_class": "positive"
        },
        {
          "field": "Interest",
          "val1": "5.08",
          "val2": "3.76",
          "chgp": "35.11%",
          "chgp_class": "negative"
        },
        {
          "field": "Exceptional Items",
          "val1": "0.00",
          "val2": "0.00",
          "chgp": "",
          "chgp_class": "neutral"
        },
        {
          "field": "Consolidate Net Profit",
          "val1": "38.25",
          "val2": "24.93",
          "chgp": "53.43%",
          "chgp_class": "positive"
        },
        {
          "field": "Operating Profit Margin (Excl OI)",
          "val1": "20.01%",
          "val2": "17.52%",
          "chgp": "2.49%",
          "chgp_class": "positive"
        }
      ]
    }
  }
]

Quarterly Results Snapshot (Consolidated) - Jun'26 - QoQstock-summary

Jun'26
Mar'26
Change(%)
Net Sales
91.79
87.18
5.29%
Operating Profit (PBDIT) excl Other Income
20.12
21.61
-6.89%
Interest
1.37
1.40
-2.14%
Exceptional Items
0.00
0.00
Consolidate Net Profit
14.11
13.78
2.39%
Operating Profit Margin (Excl OI)
21.92%
24.79%
-2.87%
Values in Rs Cr.
Direction Arrows
Net Sales

QoQ Growth in quarter ended Jun 2026 is 5.29% vs 13.35% in Mar 2026

Direction Arrows
Consolidated Net Profit

QoQ Growth in quarter ended Jun 2026 is 2.39% vs 48.97% in Mar 2026

Half Yearly Results Snapshot (Consolidated) - Sep'25stock-summary

Sep'25
Sep'24
Change(%)
Net Sales
129.72
117.08
10.80%
Operating Profit (PBDIT) excl Other Income
22.70
22.16
2.44%
Interest
2.34
2.01
16.42%
Exceptional Items
0.00
0.00
Consolidate Net Profit
15.22
12.86
18.35%
Operating Profit Margin (Excl OI)
17.50%
18.93%
-1.43%
Values in Rs Cr.
Direction Arrows
Net Sales

Growth in half year ended Sep 2025 is 10.80% vs 10.83% in Sep 2024

Direction Arrows
Consolidated Net Profit

Growth in half year ended Sep 2025 is 18.35% vs -2.58% in Sep 2024

Nine Monthly Results Snapshot (Consolidated) - Dec'25stock-summary

Dec'25
Dec'24
Change(%)
Net Sales
206.63
175.47
17.76%
Operating Profit (PBDIT) excl Other Income
37.16
31.91
16.45%
Interest
3.68
3.24
13.58%
Exceptional Items
0.00
0.00
Consolidate Net Profit
24.47
18.33
33.50%
Operating Profit Margin (Excl OI)
17.98%
18.19%
-0.21%
Values in Rs Cr.
Direction Arrows
Net Sales

YoY Growth in nine months ended Dec 2025 is 17.76% vs 11.67% in Dec 2024

Direction Arrows
Consolidated Net Profit

YoY Growth in nine months ended Dec 2025 is 33.50% vs -1.82% in Dec 2024

Annual Results Snapshot (Consolidated) - Mar'26stock-summary

Mar'26
Mar'25
Change(%)
Net Sales
293.81
239.28
22.79%
Operating Profit (PBDIT) excl Other Income
58.78
41.92
40.22%
Interest
5.08
3.76
35.11%
Exceptional Items
0.00
0.00
Consolidate Net Profit
38.25
24.93
53.43%
Operating Profit Margin (Excl OI)
20.01%
17.52%
2.49%
Values in Rs Cr.
Direction Arrows
Net Sales

YoY Growth in year ended Mar 2026 is 22.79% vs 13.54% in Mar 2025

Direction Arrows
Consolidated Net Profit

YoY Growth in year ended Mar 2026 is 53.43% vs 2.34% in Mar 2025

stock-summaryCompany CV
About Menon Bearings Ltd stock-summary
stock-summary
Menon Bearings Ltd
Micro Cap
Auto Components & Equipments
Incorporated as a public limited company on 4 Jul.'91, Menon Bearings (MBL) commenced business on 23 Sep.'91. Promoted by Menon Pistons, MBL is engaged into manufacturing of critical engine components i.e Bearings, bushes, thrust washers used in long haul, heavy duty diesel engines & multi axle vehicles at two locations and manufacturing of aluminium die casting components at another location.
Company Coordinates stock-summary
Company Details
G-I MIDC, Gokul-Shrigaon Kolhapur Maharashtra : 416234
stock-summary
Tel: 91-231-2672279/533/487
stock-summary
admin@menonbearing.in
Registrar Details
Link Intime India Pvt Ltd, C-13 Pannalal Silk Compound, L B S Marg, Bhandup , Mumbai