Menon Pistons

  • Market Cap: Micro Cap
  • Industry: Auto Components & Equipments
  • ISIN: INE650G01029
  • NSEID: MENNPIS
  • BSEID: 531727
INR
80.43
-3.85 (-4.57%)
BSENSE

Sep 09, 03:30 PM

BSE+NSE Vol: 1.84 lacs

  • Price Points
  • Score
  • Mojo Parameters
  • Total Return
  • News and Corporate Actions
  • Key factors
  • Shareholding
  • Financials
  • CompanyCV
stock-summaryPrice Point
High/Low

1Day

52 Week

Valuation
Technical
Day's Volume

CASH

1.84 lacs (-29.43%) Volume

Shareholding (Jun 2026)

FII

0.00%

Held by 0 FIIs

DII

0.03%

Held by 0 DIIs

Promoter

74.37%

Why is Menon Pistons Ltd falling/rising?

06-Sep-2026

As of 05-Sep, Menon Pistons Ltd's stock price is rising to Rs 77.52, reflecting a 3.9% increase. The stock has outperformed the Sensex and shows strong fundamentals, indicating a bullish trend and investor confidence.

As of 05-Sep, Menon Pistons Ltd's stock price is rising, currently at Rs 77.52, reflecting a change of Rs 2.91 or 3.9% increase. This upward movement is supported by several positive indicators. Over the past week, the stock has increased by 4.76%, significantly outperforming the Sensex, which has declined by 0.97%. Additionally, the stock has shown a strong performance over the past month with a rise of 5.96%, while the Sensex has fallen by 2.44%. Year-to-date, Menon Pistons has delivered an impressive return of 36.84%, compared to a decline of 10.21% in the Sensex.<BR><BR>Today's performance is particularly noteworthy, as the stock has outperformed its sector by 4.4% and has been gaining for the last two days, accumulating a total return of 4.83% during this period. The stock also touched an intraday high of Rs 79.43, marking a 6.46% increase at its peak. Furthermore, Menon Pistons is trading above its moving averages across various time frames, indicating a strong bullish trend.<BR><BR>Despite a slight decline in investor participation, with delivery volume decreasing by 29.09% compared to the 5-day average, the stock remains liquid enough for trading. The company's strong fundamentals, including a high return on equity (ROE) of 16.98% and a low debt-to-equity ratio of 0.06, contribute to its attractiveness as an investment. Positive financial results, including record net sales and a high debtors turnover ratio, further bolster investor confidence.<BR><BR>Overall, the combination of strong recent performance, positive financial metrics, and market-beating returns over the past year supports the rise in Menon Pistons Ltd's stock price.

View full answer

Who are in the management team of Menon Pistons?

01-Sep-2026

The management team of Menon Pistons includes Sachin Ram Menon (Chairman & Managing Director), Ajitkumar S Belur, Neha Marathe, Subhash Kutte, and Shrikant Raghunath Sambhoos (all Independent Directors), R D Dixit (Non-Executive & Non-Independent Director), and Pramod Suryavanshi (Company Secretary & Compliance Officer).

The management team of Menon Pistons includes the following members:<BR><BR>1. **Sachin Ram Menon** - Chairman & Managing Director<BR>2. **Ajitkumar S Belur** - Independent Director<BR>3. **Neha Marathe** - Independent Director<BR>4. **Subhash Kutte** - Independent Director<BR>5. **Shrikant Raghunath Sambhoos** - Independent Director<BR>6. **R D Dixit** - Non-Executive & Non-Independent Director<BR>7. **Pramod Suryavanshi** - Company Secretary & Compliance Officer<BR><BR>If you need more details about any specific member or their roles, feel free to ask!

View full answer

What does Menon Pistons do?

01-Sep-2026

Menon Pistons Ltd manufactures pistons for the automobile and diesel engine sectors, with a market cap of INR 370 Cr and reported net sales of 83 Cr and net profit of 8 Cr for June 2026. The company has a P/E ratio of 14.00 and a dividend yield of 1.36%.

Overview: <BR>Menon Pistons Ltd manufactures pistons for the automobile industry and diesel engine sector, operating within the Auto Components & Equipments industry as a micro-cap company.<BR><BR>History: <BR>Menon Pistons Limited was incorporated as a private limited company in August 1977, converted into a deemed public company in 1988, and became a full-fledged public limited company in November 1994. The latest quarterly results reported net sales and net profit for June 2026.<BR><BR>Financial Snapshot: <BR>Net Sales: 83 Cr (Quarterly Results - Jun 2026) <BR>Net Profit: 8 Cr (Quarterly Results - Jun 2026) <BR>Market Cap: INR 370 Cr (Micro Cap)<BR><BR>Key Metrics: <BR>P/E: 14.00 <BR>Industry P/E: 41 <BR>Dividend Yield: 1.36% <BR>Debt Equity: -0.02 <BR>Return on Equity: 14.52% <BR>Price to Book: 2.11<BR><BR>Contact Details: <BR>Address: 182 Shiroli, Kolhapur Maharashtra: 416122 <BR>Tel: 91-230-2468041/42 <BR>Email: oad@meonpistons.com/cs@menonpistion <BR>Website: http://www.menonpistons.com

View full answer

Who are the peers of the Menon Pistons?

01-Sep-2026

Menon Pistons' peers include Triton Valves, CLN Energy, Munjal Showa, Omax Autos, Autoline Industr, Emmforce Auto, PPAP Automotive, Ucal, and Jay Ushin. In terms of management risk, Menon Pistons has a Good rating, while its 1-year return is 8.82%, higher than Munjal Showa's -4.25% but lower than Emmforce Auto's 85.28%.

Peers: The peers of Menon Pistons are Triton Valves, CLN Energy, Munjal Showa, Omax Autos, Autoline Industr, Emmforce Auto., PPAP Automotive, Ucal, and Jay Ushin.<BR><BR>Quality Snapshot: Excellent management risk is observed at CLN Energy and Emmforce Auto., while Good management risk is found at Menon Pistons. Average management risk is present at Munjal Showa, Omax Autos, Autoline Industr, and Jay Ushin, and the rest have Below Average management risk. For Growth, Excellent growth is noted at CLN Energy, Good growth at Autoline Industr, and Average growth at Omax Autos, while Menon Pistons, Munjal Showa, PPAP Automotive, Ucal, and Jay Ushin show Below Average growth. In terms of Capital Structure, Excellent capital structure is seen at Menon Pistons, while CLN Energy and Munjal Showa have Excellent capital structure, and the rest have Below Average capital structure.<BR><BR>Return Snapshot: Emmforce Auto. has the highest 1-year return at 85.28%, while Munjal Showa has the lowest at -4.25%. Menon Pistons has a 1-year return of 8.82%, which is higher than Munjal Showa but lower than Emmforce Auto. Additionally, the six-month return is negative for Munjal Showa and Omax Autos.

View full answer

How big is Menon Pistons?

01-Sep-2026

As of 31st August, Menon Pistons Ltd has a market capitalization of 370.00 Cr, with recent net sales of 307.12 Cr and a net profit of 26.05 Cr. The company has shareholder's funds of 177.74 Cr and total assets of 229.92 Cr as of March 2026.

As of 31st August, Menon Pistons Ltd has a market capitalization of 370.00 Cr, categorized as a Micro Cap.<BR><BR>In the latest four quarters, Menon Pistons reported Net Sales of 307.12 Cr and a Net Profit of 26.05 Cr.<BR><BR>For the latest annual period ending March 2026, the company has Shareholder's Funds amounting to 177.74 Cr and Total Assets of 229.92 Cr.

View full answer

Are Menon Pistons Ltd latest results good or bad?

06-Aug-2026

Menon Pistons Ltd's latest Q1 FY27 results are strong, with a net profit increase of 85.36% quarter-on-quarter and revenue growth of 13.71%. While the performance shows positive operational improvements, the company faces longer-term growth challenges compared to industry peers.

Menon Pistons Ltd's latest results for Q1 FY27 indicate a strong performance, showcasing significant improvements across key financial metrics. The company reported a net profit of ₹8.23 crores, which is an impressive increase of 85.36% quarter-on-quarter and 5.92% year-on-year. Revenue also saw a robust growth of 13.71% from the previous quarter, reaching ₹83.26 crores, although the year-on-year growth was more modest at 3.70%.<BR><BR>The operating margin improved to 17.30%, marking the highest level in at least seven quarters, with a substantial sequential increase of 596 basis points. The profit after tax (PAT) margin rose to 9.88%, up from 6.06% in the previous quarter, indicating effective cost management and operational efficiency.<BR><BR>Overall, these results reflect a material sequential recovery and operational improvements, despite some challenges in the broader automotive components sector. The company's zero long-term debt and strong balance sheet further enhance its financial stability. However, it's important to note that while the quarterly performance is encouraging, the company has faced growth challenges over the longer term, with revenue growth lagging behind industry peers.<BR><BR>In summary, the latest results can be considered good, highlighting a positive turnaround and operational momentum, but investors should remain aware of the ongoing challenges in achieving sustained growth.

View full answer

Should I buy, sell or hold Menon Pistons Ltd?

06-Aug-2026

When is the next results date for Menon Pistons Ltd?

21-Jan-2026

The next results date for Menon Pistons Ltd is 28 January 2026.

The next results date for Menon Pistons Ltd is scheduled for 28 January 2026.

View full answer

How has been the historical performance of Menon Pistons?

12-Nov-2025

Menon Pistons has shown steady growth in net sales and profitability over the years, with net sales at 253.66 Cr in March 2025, despite a slight decline from the previous year. While profits fluctuated, total assets and cash flow improved, indicating overall consistent growth.

Answer:<BR>The historical performance of Menon Pistons shows a steady growth in net sales and profitability over the years, with some fluctuations in specific metrics.<BR><BR>Breakdown:<BR>Menon Pistons reported net sales of 253.66 Cr in March 2025, a slight decrease from 255.61 Cr in March 2024, but an increase from 251.14 Cr in March 2023 and a significant rise from 212.44 Cr in March 2022. The total operating income mirrored this trend, remaining at 253.66 Cr in March 2025. The company's operating profit (PBDIT) increased to 46.61 Cr in March 2025 from 46.01 Cr in March 2024, and the profit before tax was 31.82 Cr, down from 34.57 Cr in the previous year. Profit after tax also saw a decline to 23.85 Cr in March 2025 from 26.45 Cr in March 2024, although it was higher than 23.34 Cr in March 2023 and 18.80 Cr in March 2022. The earnings per share (EPS) decreased to 4.68 in March 2025 from 5.19 in March 2024, while the operating profit margin remained stable at 17.7%. Total assets grew to 213.58 Cr in March 2025, up from 202.12 Cr in March 2024, and total liabilities also increased to 213.58 Cr from 202.12 Cr. The cash flow from operating activities improved to 38.00 Cr in March 2025 from 22.00 Cr in March 2024, indicating better cash generation capabilities. Overall, while Menon Pistons experienced some fluctuations in profits, its revenue and asset base have shown consistent growth over the years.

View full answer

Is Menon Pistons overvalued or undervalued?

09-Jun-2025

As of October 31, 2024, Menon Pistons is considered undervalued with a PE ratio of 13.44 and strong returns, significantly outperforming peers like Samvardhan Motherson and Bosch, making it an attractive investment in the auto components industry.

As of 31 October 2024, Menon Pistons has moved from a fair to a very attractive valuation grade. The company is currently considered undervalued, with a PE ratio of 13.44, an EV to EBITDA of 7.39, and a PEG ratio of 0.00, indicating strong earnings potential relative to its price. The return on capital employed (ROCE) stands at 20.52%, and the return on equity (ROE) is at 15.17%, further supporting the attractiveness of the investment.<BR><BR>In comparison to its peers, Menon Pistons shows a significant advantage; for instance, Samvardhan Motherson has a PE ratio of 29.14 and an EV to EBITDA of 11.53, while Bosch is considered expensive with a PE of 46.21. This positions Menon Pistons favorably within the auto components and equipment industry. Additionally, the company's recent stock performance has outpaced the Sensex over the past week and month, reinforcing its valuation story.

View full answer

What is the technical trend for Menon Pistons?

09-Jun-2025

As of May 12, 2025, Menon Pistons shows a mildly bearish trend overall, with mixed signals from MACD and moving averages indicating short-term weakness despite some bullish signs on the weekly chart.

As of 12 May 2025, the technical trend for Menon Pistons has changed from bearish to mildly bearish. The weekly MACD indicates a mildly bullish stance, while the monthly MACD remains bearish. The daily moving averages are mildly bearish, suggesting short-term weakness. Bollinger Bands show a bullish signal on the weekly chart but a mildly bearish signal on the monthly chart. The KST is mildly bullish on the weekly timeframe but bearish monthly. Overall, the lack of clear trends in the Dow Theory for both weekly and monthly periods adds to the neutral sentiment. The current technical stance is mildly bearish, driven primarily by the mixed signals from MACD and moving averages.

View full answer

Who are the top shareholders of the Menon Pistons?

06-Jun-2025

The top shareholder of Menon Pistons is Sachin Ram Menon, with 28.24% ownership. Public shareholders include Vatsala Nair at 1.18%, while individual investors hold 22.9%, and there is one foreign institutional investor with 0.03%.

The top shareholders of Menon Pistons include the promoters, who hold the majority of the shares. The promoter with the highest holding is Sachin Ram Menon, owning 28.24% of the company. In terms of public shareholders, Vatsala Nair is the highest, holding 1.18%. Additionally, individual investors collectively hold 22.9% of the shares. There are no pledged promoter holdings, and the company has one foreign institutional investor holding a small stake of 0.03%.

View full answer

Has Menon Pistons declared dividend?

06-Jun-2025

Menon Pistons Ltd has declared a 100% dividend, amounting to ₹1 per share, with an ex-date of August 5, 2024. While recent total returns show negative performance in the short term, the company has achieved positive returns over longer periods.

Menon Pistons Ltd has declared a 100% dividend.<BR><BR>Dividend Details:<BR>- Percentage announced: 100%<BR>- Amount per share: 1 per share<BR>- Ex-date: 05 Aug 24<BR><BR>Dividend Yield: 1.59%.<BR><BR>Total Returns by Period:<BR>In the last 6 months, the price return was -18.07%, with a dividend return of 0%, resulting in a total return of -18.07%.<BR><BR>Over the past year, the price return was -28.63%, the dividend return was 1.12%, leading to a total return of -27.51%.<BR><BR>In the 2-year period, the price return was 4.78%, the dividend return was 3.29%, culminating in a total return of 8.07%.<BR><BR>For the 3-year period, the price return reached 39.01%, with a dividend return of 7.14%, resulting in a total return of 46.15%.<BR><BR>In the last 4 years, the price return was 122.12%, the dividend return was 10.09%, which brought the total return to 132.21%.<BR><BR>Over the past 5 years, the price return was 380.69%, with a dividend return of 20.24%, leading to a total return of 400.93%.<BR><BR>Overall, Menon Pistons has declared a significant dividend, but the recent total returns indicate a mixed performance, with negative returns in the short term and positive returns over longer periods.

View full answer
iScoreScore
Click here to find our call on this stock
Strong Sell
Sell
Hold
Buy
Strong Buy

Dashboard

1

High Management Efficiency with a high ROE of 16.98%

 
2

Company has a Debt to Equity ratio (avg) of 0.06 times

 
3

Positive results in Jun 26

4

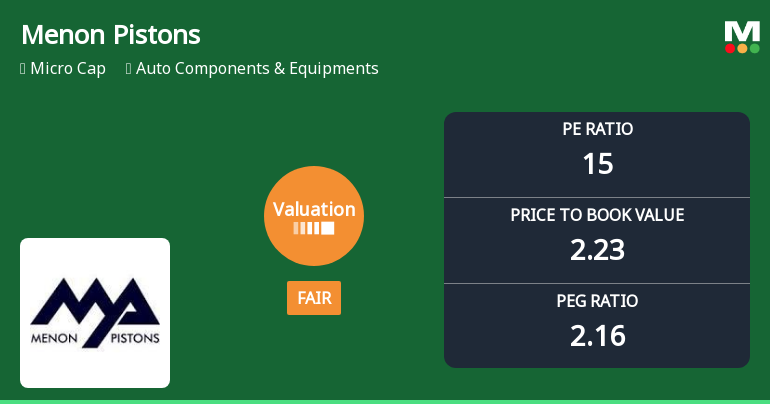
With ROE of 14.5, it has a Fair valuation with a 2.3 Price to Book Value

5

Majority shareholders : Promoters

 
stock-summaryMojo Parameters

Mojo Parameters

Loading Valuation Snapshot...

Stock DNA

stock-summary
Industry

Auto Components & Equipments

stock-summary
Market cap

INR 408 Cr (Micro Cap)

stock-summary
P/E

16.00

stock-summary
Industry P/E

40

stock-summary
Dividend Yield

1.19%

stock-summary
Debt Equity

-0.02

stock-summary
Return on Equity

14.52%

stock-summary
Price to Book

2.42

Revenue and Profits:
Net Sales:
83 Cr
(Quarterly Results - Jun 2026)
Net Profit:
8 Cr
stock-summaryTotal Returns
Total Returns (Price + Dividend) stock-summary
Dividend Yield (1.19%)
TimePeriod
Price Return
Dividend Return
Total Return
3 Months
48.26%
1.80%
50.06%
6 Months
0%
0%
0.0%
1 Year
0%
0%
0.0%
2 Years
0%
0%
0.0%
3 Years
0%
0%
0.0%
4 Years
0%
0%
0.0%
5 Years
0%
0%
0.0%

Latest dividend: 1 per share ex-dividend date: Jul-28-2026

Risk Adjusted Returns v/s stock-summary
Returns Beta
Icon
Beta has not been calculated since enough price history is not available
stock-summaryNews & Corporate Actions

Announcements stock-summary

Icon
No announcement available

Corporate Actions stock-summary

stock-summary
BOARD MEETING

No Upcoming Board Meetings

stock-summary
DIVIDEND

Menon Pistons Ltd has declared 100% dividend, ex-date: 28 Jul 26

stock-summary
SPLITS

Menon Pistons Ltd has announced 1:10 stock split, ex-date: 20 Oct 16

stock-summary
BONUS

No Bonus history available

stock-summary
RIGHTS

No Rights history available

stock-summaryKey Factors

Quality key factors stock-summary

Factor
Value
Sales Growth (5y)
8.33%
EBIT Growth (5y)
4.37%
EBIT to Interest (avg)
11.37
Debt to EBITDA (avg)
0.60
Net Debt to Equity (avg)
-0.02
Sales to Capital Employed (avg)
1.50
Tax Ratio
25.45%
Dividend Payout Ratio
21.39%
Pledged Shares
0
Institutional Holding
0.03%
ROCE (avg)
21.11%
ROE (avg)
16.98%

Valuation key factors

Factor
Value
P/E Ratio
16
Industry P/E
40
Price to Book Value
2.33
EV to EBIT
11.57
EV to EBITDA
8.56
EV to Capital Employed
2.36
EV to Sales
1.33
PEG Ratio
2.25
Dividend Yield
1.23%
ROCE (Latest)
20.24%
ROE (Latest)
14.52%

Technicals key factors

Indicator
Weekly
Monthly
MACD
Bullish
Bullish
RSI
Bearish
No Signal
Bollinger Bands
Bullish
Bullish
Moving Averages
Bullish (Daily)
KST
Bullish
Mildly Bullish
Dow Theory
Mildly Bullish
Mildly Bullish
OBV
Bullish
Bullish
stock-summary Technical Indicator Scale: Bearish, Mildly Bearish, Sideways, Mildly Bullish, Bullish  Turned 
stock-summaryShareholding
Shareholding Snapshot : Jun 2026stock-summary
Shareholding Compare (%holding) stock-summary
Majority shareholders

Promoters

Pledged Promoter Holdings

None

Mutual Funds

Held by 0 Schemes

FIIs

Held by 0 FIIs

Promoter with highest holding

Sachin Ram Menon (28.24%)

Highest Public shareholder

Vatsala Nair (1.14%)

Individual Investors Holdings

22.93%

stock-summaryFinancial
[
  {
    "link": "quarterly",
    "btn_text": "All Quarterly Results",
    "header": "Quarterly Results Snapshot (Consolidated) - Jun'26 - QoQ",
    "rhs": [
      {
        "prefix": "Net Sales ",
        "suffix": "QoQ Growth in quarter ended Jun 2026 is 13.71% vs -3.78% in Mar 2026",
        "dir": 1
      },
      {
        "prefix": "Consolidated Net Profit ",
        "suffix": "QoQ Growth in quarter ended Jun 2026 is 85.36% vs -30.95% in Mar 2026",
        "dir": 1
      }
    ],
    "table": {
      "header": [
        "Jun'26",
        "Mar'26",
        "Change(%)"
      ],
      "body": [
        {
          "field": "Net Sales",
          "val1": "83.26",
          "val2": "73.22",
          "chgp": "13.71%",
          "chgp_class": "positive"
        },
        {
          "field": "Operating Profit (PBDIT) excl Other Income",
          "val1": "14.40",
          "val2": "8.30",
          "chgp": "73.49%",
          "chgp_class": "positive"
        },
        {
          "field": "Interest",
          "val1": "0.73",
          "val2": "0.79",
          "chgp": "-7.59%",
          "chgp_class": "positive"
        },
        {
          "field": "Exceptional Items",
          "val1": "0.00",
          "val2": "-0.03",
          "chgp": "100.00%",
          "chgp_class": "positive"
        },
        {
          "field": "Consolidate Net Profit",
          "val1": "8.23",
          "val2": "4.44",
          "chgp": "85.36%",
          "chgp_class": "positive"
        },
        {
          "field": "Operating Profit Margin (Excl OI)",
          "val1": "17.30%",
          "val2": "11.34%",
          "chgp": "5.96%",
          "chgp_class": "positive"
        }
      ]
    }
  },
  {
    "link": "half-yearly",
    "btn_text": "All Half Yearly Results",
    "header": "Half Yearly Results Snapshot (Consolidated) - Sep'25",
    "rhs": [
      {
        "prefix": "Net Sales ",
        "suffix": " Growth in half year ended Sep 2025 is 14.87% vs -1.09% in Sep 2024",
        "dir": 1
      },
      {
        "prefix": "Consolidated Net Profit ",
        "suffix": " Growth in half year ended Sep 2025 is 6.83% vs -7.34% in Sep 2024",
        "dir": 1
      }
    ],
    "table": {
      "header": [
        "Sep'25",
        "Sep'24",
        "Change(%)"
      ],
      "body": [
        {
          "field": "Net Sales",
          "val1": "154.83",
          "val2": "134.79",
          "chgp": "14.87%",
          "chgp_class": "positive"
        },
        {
          "field": "Operating Profit (PBDIT) excl Other Income",
          "val1": "26.11",
          "val2": "25.10",
          "chgp": "4.02%",
          "chgp_class": "positive"
        },
        {
          "field": "Interest",
          "val1": "2.02",
          "val2": "2.02",
          "chgp": "",
          "chgp_class": "neutral"
        },
        {
          "field": "Exceptional Items",
          "val1": "0.00",
          "val2": "0.00",
          "chgp": "",
          "chgp_class": "neutral"
        },
        {
          "field": "Consolidate Net Profit",
          "val1": "14.71",
          "val2": "13.77",
          "chgp": "6.83%",
          "chgp_class": "positive"
        },
        {
          "field": "Operating Profit Margin (Excl OI)",
          "val1": "16.86%",
          "val2": "18.62%",
          "chgp": "-1.76%",
          "chgp_class": "negative"
        }
      ]
    }
  },
  {
    "link": "nine-monthly",
    "btn_text": "All Nine Monthly Results",
    "header": "Nine Monthly Results Snapshot (Consolidated) - Dec'25",
    "rhs": [
      {
        "prefix": "Net Sales ",
        "suffix": "YoY Growth in nine months ended Dec 2025 is 16.69% vs 1.23% in Dec 2024",
        "dir": 1
      },
      {
        "prefix": "Consolidated Net Profit ",
        "suffix": "YoY Growth in nine months ended Dec 2025 is 7.91% vs 1.98% in Dec 2024",
        "dir": 1
      }
    ],
    "table": {
      "header": [
        "Dec'25",
        "Dec'24",
        "Change(%)"
      ],
      "body": [
        {
          "field": "Net Sales",
          "val1": "230.93",
          "val2": "197.90",
          "chgp": "16.69%",
          "chgp_class": "positive"
        },
        {
          "field": "Operating Profit (PBDIT) excl Other Income",
          "val1": "38.65",
          "val2": "35.63",
          "chgp": "8.48%",
          "chgp_class": "positive"
        },
        {
          "field": "Interest",
          "val1": "2.80",
          "val2": "3.10",
          "chgp": "-9.68%",
          "chgp_class": "positive"
        },
        {
          "field": "Exceptional Items",
          "val1": "-0.28",
          "val2": "0.00",
          "chgp": "",
          "chgp_class": "neutral"
        },
        {
          "field": "Consolidate Net Profit",
          "val1": "21.14",
          "val2": "19.59",
          "chgp": "7.91%",
          "chgp_class": "positive"
        },
        {
          "field": "Operating Profit Margin (Excl OI)",
          "val1": "16.74%",
          "val2": "18.00%",
          "chgp": "-1.26%",
          "chgp_class": "negative"
        }
      ]
    }
  },
  {
    "link": "annual",
    "btn_text": "All Annual Results",
    "header": "Annual Results Snapshot (Consolidated) - Mar'26",
    "rhs": [
      {
        "prefix": "Net Sales ",
        "suffix": "YoY Growth in year ended Mar 2026 is 19.91% vs -0.76% in Mar 2025",
        "dir": 1
      },
      {
        "prefix": "Consolidated Net Profit ",
        "suffix": "YoY Growth in year ended Mar 2026 is 7.25% vs -9.83% in Mar 2025",
        "dir": 1
      }
    ],
    "table": {
      "header": [
        "Mar'26",
        "Mar'25",
        "Change(%)"
      ],
      "body": [
        {
          "field": "Net Sales",
          "val1": "304.16",
          "val2": "253.66",
          "chgp": "19.91%",
          "chgp_class": "positive"
        },
        {
          "field": "Operating Profit (PBDIT) excl Other Income",
          "val1": "46.96",
          "val2": "44.89",
          "chgp": "4.61%",
          "chgp_class": "positive"
        },
        {
          "field": "Interest",
          "val1": "3.58",
          "val2": "4.17",
          "chgp": "-14.15%",
          "chgp_class": "positive"
        },
        {
          "field": "Exceptional Items",
          "val1": "-0.31",
          "val2": "0.00",
          "chgp": "",
          "chgp_class": "neutral"
        },
        {
          "field": "Consolidate Net Profit",
          "val1": "25.58",
          "val2": "23.85",
          "chgp": "7.25%",
          "chgp_class": "positive"
        },
        {
          "field": "Operating Profit Margin (Excl OI)",
          "val1": "15.44%",
          "val2": "17.70%",
          "chgp": "-2.26%",
          "chgp_class": "negative"
        }
      ]
    }
  }
]

Quarterly Results Snapshot (Consolidated) - Jun'26 - QoQstock-summary

Jun'26
Mar'26
Change(%)
Net Sales
83.26
73.22
13.71%
Operating Profit (PBDIT) excl Other Income
14.40
8.30
73.49%
Interest
0.73
0.79
-7.59%
Exceptional Items
0.00
-0.03
100.00%
Consolidate Net Profit
8.23
4.44
85.36%
Operating Profit Margin (Excl OI)
17.30%
11.34%
5.96%
Values in Rs Cr.
Direction Arrows
Net Sales

QoQ Growth in quarter ended Jun 2026 is 13.71% vs -3.78% in Mar 2026

Direction Arrows
Consolidated Net Profit

QoQ Growth in quarter ended Jun 2026 is 85.36% vs -30.95% in Mar 2026

Half Yearly Results Snapshot (Consolidated) - Sep'25stock-summary

Sep'25
Sep'24
Change(%)
Net Sales
154.83
134.79
14.87%
Operating Profit (PBDIT) excl Other Income
26.11
25.10
4.02%
Interest
2.02
2.02
Exceptional Items
0.00
0.00
Consolidate Net Profit
14.71
13.77
6.83%
Operating Profit Margin (Excl OI)
16.86%
18.62%
-1.76%
Values in Rs Cr.
Direction Arrows
Net Sales

Growth in half year ended Sep 2025 is 14.87% vs -1.09% in Sep 2024

Direction Arrows
Consolidated Net Profit

Growth in half year ended Sep 2025 is 6.83% vs -7.34% in Sep 2024

Nine Monthly Results Snapshot (Consolidated) - Dec'25stock-summary

Dec'25
Dec'24
Change(%)
Net Sales
230.93
197.90
16.69%
Operating Profit (PBDIT) excl Other Income
38.65
35.63
8.48%
Interest
2.80
3.10
-9.68%
Exceptional Items
-0.28
0.00
Consolidate Net Profit
21.14
19.59
7.91%
Operating Profit Margin (Excl OI)
16.74%
18.00%
-1.26%
Values in Rs Cr.
Direction Arrows
Net Sales

YoY Growth in nine months ended Dec 2025 is 16.69% vs 1.23% in Dec 2024

Direction Arrows
Consolidated Net Profit

YoY Growth in nine months ended Dec 2025 is 7.91% vs 1.98% in Dec 2024

Annual Results Snapshot (Consolidated) - Mar'26stock-summary

Mar'26
Mar'25
Change(%)
Net Sales
304.16
253.66
19.91%
Operating Profit (PBDIT) excl Other Income
46.96
44.89
4.61%
Interest
3.58
4.17
-14.15%
Exceptional Items
-0.31
0.00
Consolidate Net Profit
25.58
23.85
7.25%
Operating Profit Margin (Excl OI)
15.44%
17.70%
-2.26%
Values in Rs Cr.
Direction Arrows
Net Sales

YoY Growth in year ended Mar 2026 is 19.91% vs -0.76% in Mar 2025

Direction Arrows
Consolidated Net Profit

YoY Growth in year ended Mar 2026 is 7.25% vs -9.83% in Mar 2025

stock-summaryCompany CV
About Menon Pistons Ltd stock-summary
stock-summary
Menon Pistons Ltd
Micro Cap
Auto Components & Equipments
Menon Pistons Limited was incorporated as a private limited company in Aug.'77 and was converted into a deemed public company in 1988. The company became a full-fledged public limited company in Nov.'94. Promoted by the late Chandran Menon and Ram Menon, the company was manufacturing pistons to cater to the need of small diesel engine manufacturers. Subsequently, it started supplying the high value added pistons required for the automobile industry and diesel engine sector.
Company Coordinates stock-summary
Company Details
182 Shiroli , Kolhapur Maharashtra : 416122
stock-summary
Tel: 91-230-2468041/42
stock-summary
oad@meonpistons.com/cs@menonpistion
Registrar Details
Link Intime India Pvt Ltd, Block No 202, 2nd Floor, Akshay Complex, Near Ganesh Temple, Off Dhole Patil Road , Pune