
Compare Metropolis Healt with Similar Stocks
Dashboard
Strong ability to service debt as the company has a low Debt to EBITDA ratio of 0.58 times
Poor long term growth as Net Sales has grown by an annual rate of 10.52% and Operating profit at 2.16% over the last 5 years
The company has declared Positive results for the last 3 consecutive quarters
With ROE of 13, it has a Expensive valuation with a 7.4 Price to Book Value
High Institutional Holdings at 46.23%
Market Beating performance in long term as well as near term
Stock DNA
Healthcare Services
INR 11,359 Cr (Small Cap)
57.00
62
0.37%
0.02
13.00%
7.43
Total Returns (Price + Dividend) 
Latest dividend: 1.0010826771653543 per share ex-dividend date: May-19-2026
Risk Adjusted Returns v/s
Returns Beta

News
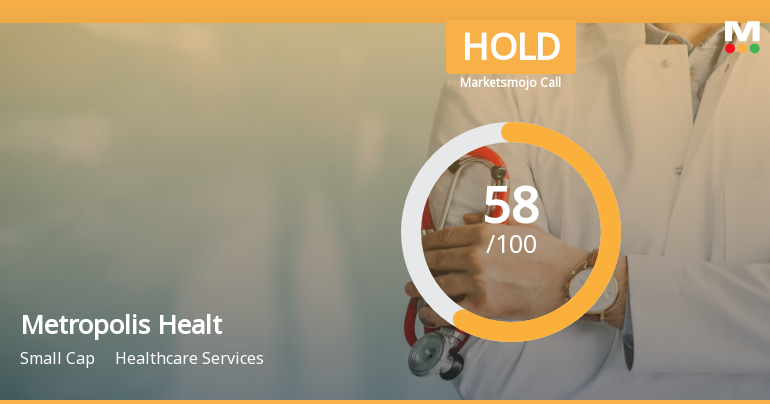
Metropolis Healthcare Ltd is Rated Hold by MarketsMOJO
Metropolis Healthcare Ltd is rated 'Hold' by MarketsMOJO, with this rating last updated on 04 May 2026. However, the analysis and financial metrics discussed here reflect the company’s current position as of 19 June 2026, providing investors with the most recent insights into its performance and outlook.
Read full news article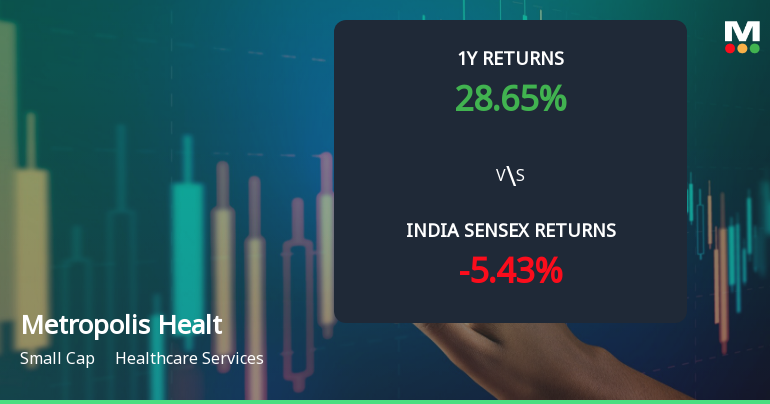
Metropolis Healthcare Ltd Shows Mixed Technical Signals Amid Mildly Bullish Momentum
Metropolis Healthcare Ltd has experienced a notable shift in its technical momentum, moving from a bullish to a mildly bullish trend as of mid-June 2026. Despite positive signals from key indicators such as MACD and moving averages, bearish readings from RSI and mixed signals from Dow Theory and OBV suggest a nuanced outlook for this small-cap healthcare services stock.
Read full news article
Metropolis Healthcare Ltd is Rated Hold
Metropolis Healthcare Ltd is rated 'Hold' by MarketsMOJO, with this rating last updated on 04 May 2026. However, the analysis and financial metrics discussed here reflect the company’s current position as of 08 June 2026, providing investors with an up-to-date view of its fundamentals, returns, and market performance.
Read full news article Announcements
Announcement under Regulation 30 (LODR)-Analyst / Investor Meet - Intimation
04-Jun-2026 | Source : BSESchedule of Analyst / Institutional Investor Meeting
Compliances-Reg.24(A)-Annual Secretarial Compliance
28-May-2026 | Source : BSEAnnual Secretarial Compliance Report for the financial year ended March 31 2026
Announcement under Regulation 30 (LODR)-Earnings Call Transcript
19-May-2026 | Source : BSETranscript of Q4 FY26 earnings conference call held on Thursday May 14 2026
Corporate Actions

No Upcoming Board Meetings

Metropolis Healthcare Ltd has declared 50% dividend, ex-date: 19 May 26

No Splits history available

Metropolis Healthcare Ltd has announced 3:1 bonus issue, ex-date: 20 Mar 26

No Rights history available
Quality key factors
Valuation key factors
Technicals key factors
 Technical Indicator Scale: Bearish, Mildly Bearish, Sideways, Mildly Bullish, Bullish Turned
 Shareholding Snapshot : Mar 2026
Shareholding Compare (%holding)
Promoters
1.1845
Held by 27 Schemes (32.93%)
Held by 129 FIIs (10.77%)
Metz Advisory Llp (30.27%)
Hdfc Mutual Fund - Hdfc Focused Fund (9.66%)
4.02%
Quarterly Results Snapshot (Consolidated) - Mar'26 - QoQ

QoQ Growth in quarter ended Mar 2026 is 4.62% vs -5.42% in Dec 2025
QoQ Growth in quarter ended Mar 2026 is 22.98% vs -21.42% in Dec 2025
Half Yearly Results Snapshot (Consolidated) - Sep'25
Growth in half year ended Sep 2025 is 22.94% vs 13.24% in Sep 2024

Growth in half year ended Sep 2025 is 15.70% vs 31.47% in Sep 2024
Nine Monthly Results Snapshot (Consolidated) - Dec'25
YoY Growth in nine months ended Dec 2025 is 23.86% vs 12.46% in Dec 2024
YoY Growth in nine months ended Dec 2025 is 20.11% vs 26.71% in Dec 2024
Annual Results Snapshot (Consolidated) - Mar'26
YoY Growth in year ended Mar 2026 is 23.64% vs 10.23% in Mar 2025
YoY Growth in year ended Mar 2026 is 31.08% vs 13.42% in Mar 2025
About Metropolis Healthcare Ltd

Company Coordinates


