Midwest Energy

  • Market Cap: Small Cap
  • Industry: Miscellaneous
  • ISIN: INE519N01014
  • NSEID:
  • BSEID: 526570
INR
3,118.95
-36.55 (-1.16%)
BSENSE

Aug 10, 01:37 PM

BSE+NSE Vol: 1.25 k

  • Price Points
  • Score
  • Mojo Parameters
  • Total Return
  • News and Corporate Actions
  • Key factors
  • Shareholding
  • Financials
  • CompanyCV
stock-summaryPrice Point
High/Low

1Day

52 Week

Valuation
Technical
Day's Volume

CASH

1.25 k (-6.30%) Volume

Shareholding (Jun 2026)

FII

12.63%

Held by 6 FIIs

DII

1.58%

Held by 0 DIIs

Promoter

58.45%

Why is Midwest Gold Ltd falling/rising?

10-Aug-2026

As of 09-Aug, the stock price of Midwest Energy Ltd is declining, currently at 3,155.50, reflecting a significant drop of 3.34%. The stock has underperformed over various periods, with a negative outlook due to operational losses and weak fundamentals.

As of 09-Aug, the stock price of Midwest Energy Ltd is falling, currently at 3,155.50, which reflects a decrease of 109.1 points or 3.34%. This decline is part of a broader trend, as the stock has been underperforming significantly over various periods, with a 17.92% drop over the past week and a 24.38% decline over the past month. Additionally, the stock has experienced a consecutive fall over the last five days, resulting in a total return decrease of 17.86% during this timeframe.<BR><BR>Today's trading performance indicates that the stock has underperformed its sector by 1.26%, and it reached an intraday low of Rs 3,110, marking a 4.74% decrease. The trading volume has also shown a concerning trend, with delivery volume on August 6 falling by 52.82% compared to the five-day average, suggesting reduced investor interest. Furthermore, the stock is trading below its moving averages across multiple timeframes, including the 5-day, 20-day, 50-day, 100-day, and 200-day averages, reinforcing the bearish sentiment.<BR><BR>Despite some positive factors, such as the company declaring positive results for the last three consecutive quarters and an increase in institutional investor participation, the overall outlook remains negative. The company is facing operational losses and has a weak long-term fundamental strength, with an annual operating profit growth rate of -9.18% over the last five years. Additionally, the company's negative EBITDA of Rs -1.6 crore and a poor EBIT to interest ratio of -1.75 further contribute to the stock's decline, making it a risky investment.

View full answer

When is the next results date for Midwest Gold Ltd?

06-Aug-2026

The next results date for Midwest Gold Ltd is August 10, 2026.

The next results date for Midwest Gold Ltd is scheduled for August 10, 2026.

View full answer

Should I buy, sell or hold Midwest Gold Ltd?

04-Aug-2026

How big is Midwest Gold?

11-Jun-2026

As of 10th June, Midwest Gold Ltd has a market capitalization of 5,164.00 Cr, with Net Sales of 8.65 Cr and a Net Profit loss of 13.36 Cr over the latest four quarters. Shareholder's Funds are 88.75 Cr and Total Assets are valued at 204.53 Cr as of March 2025.

As of 10th June, Midwest Gold Ltd has a market capitalization of 5,164.00 Cr, categorizing it as a Small Cap company.<BR><BR>In the latest four quarters, Midwest Gold reported Net Sales of 8.65 Cr. However, the company experienced a loss of 13.36 Cr in Net Profit during the same period.<BR><BR>The latest annual period for the balance sheet is March 2025, where Shareholder's Funds amounted to 88.75 Cr and Total Assets were valued at 204.53 Cr.

View full answer

Who are in the management team of Midwest Gold?

11-Jun-2026

The management team of Midwest Gold includes Deepak Kukreti and B S Raju as Executive Directors, G. Bhaskara Rao as Chairman, and several other directors including Kothamasu Sri Surya Pratap, Rao Sasikanth, Ankireddy Rajyalakshmi, and Sudi Malyadri, with Anushka Agarwal serving as Company Secretary.

The management team of Midwest Gold includes the following individuals:<BR><BR>1. Deepak Kukreti - Executive Director & Wholetime Director<BR>2. B S Raju - Executive Director & Wholetime Director<BR>3. G. Bhaskara Rao - Chairman & Independent Director<BR>4. Kothamasu Sri Surya Pratap - Independent Non-Executive Director<BR>5. Rao Sasikanth - Non-Executive Director<BR>6. Ankireddy Rajyalakshmi - Non-Executive Women Director<BR>7. Sudi Malyadri - Chairman<BR>8. Anushka Agarwal - Company Secretary & Compliance Officer<BR><BR>If you need more information about any specific member or their roles, feel free to ask!

View full answer

Who are the peers of the Midwest Gold?

11-Jun-2026

Midwest Gold's peers include Doms Industries, Sandur Manganese, Knowledge Marine, Crizac, Navneet Educat., Dredging Corpn., Flair Writing, Ramco Inds., and Creative Newtech. Midwest Gold has below average management risk and capital structure, while its 1-year return is significantly higher at 451.74%.

Peers: The peers of Midwest Gold are Doms Industries, Sandur Manganese, Knowledge Marine, Crizac, Navneet Educat., Dredging Corpn., Flair Writing, Ramco Inds., and Creative Newtech.<BR><BR>Quality Snapshot: Excellent management risk is observed at Doms Industries, Crizac, and the rest. Average management risk is found at Sandur Manganese, Knowledge Marine, Navneet Educat., Dredging Corpn., Flair Writing, Ramco Inds., and Creative Newtech. Below Average management risk is attributed to Midwest Gold. For growth, Excellent growth is seen at Sandur Manganese, Knowledge Marine, Crizac, and the rest. Good growth is noted at Navneet Educat., while Below Average growth is present at Doms Industries, Midwest Gold, Dredging Corpn., Flair Writing, and Ramco Inds. Finally, Excellent capital structure is found at Doms Industries, Sandur Manganese, Crizac, Navneet Educat., and the rest, while Midwest Gold has a Below Average capital structure.<BR><BR>Return Snapshot: The peer with the highest 1-year return is Sandur Manganese at 31.42%, while the peer with the lowest is Crizac, which has no available data. Midwest Gold's 1-year return is significantly higher at 451.74%. Additionally, the peers with negative six-month returns include Doms Industries, Crizac, and Ramco Inds.

View full answer

What does Midwest Gold do?

10-Jun-2026

Midwest Gold Ltd, originally Nova Granites (India) Ltd, trades granite and marbles and is classified as a small-cap company with a market cap of INR 5,164 Cr. As of March 2026, it reported net sales of 6 Cr and a net loss of 3 Cr.

Overview:<BR>Midwest Gold Ltd is engaged in the trading business of granite and marbles within the miscellaneous industry and is classified as a small-cap company.<BR><BR>History:<BR>Midwest Gold Ltd was originally incorporated in November 1990 in Karnataka as Nova Granites (India) Ltd. The company has undergone a name change and has been operational since its inception, with the latest reported quarterly results for net sales and profit being for March 2026.<BR><BR>Financial Snapshot:<BR>Net Sales: 6 Cr (Quarterly Results - Mar 2026) <BR>Net Profit: -3 Cr (Quarterly Results - Mar 2026) <BR>Market Cap: INR 5,164 Cr (Small Cap)<BR><BR>Key Metrics:<BR>P/E: N/A <BR>Industry P/E: 21 <BR>Dividend Yield: 0.00% <BR>Debt Equity: -0.17 <BR>Return on Equity: 0.73% <BR>Price to Book: 12.16 <BR><BR>Contact Details:<BR>Address: No 25 A Attibele Indust Area, Attibele Bangalore Karnataka : 562107 <BR>Tel: 91-80-27820407 <BR>Email: novagranites1990@gmail.com <BR>Website: http://www.midwestgoldltd.com

View full answer

Are Midwest Gold Ltd latest results good or bad?

02-Jun-2026

Midwest Gold Ltd's latest results show significant revenue growth of 380% to ₹5.76 crores, but the company reported a net loss of ₹3.45 crores and a negative operating margin of -55.9%, indicating ongoing financial challenges and caution for investors.

Midwest Gold Ltd's latest results present a mixed picture, leaning towards the negative side. While the company experienced a significant revenue growth of 380% quarter-over-quarter, reaching ₹5.76 crores in Q4 FY26, it simultaneously reported a net loss of ₹3.45 crores, which is an increase in losses compared to the previous quarter. This indicates that despite the surge in sales, operational inefficiencies persist.<BR><BR>The operating margin remains deeply negative at -55.9%, reflecting ongoing challenges in managing costs effectively. Moreover, the company has accumulated losses exceeding ₹13 crores during FY26, raising concerns about its long-term viability. The extreme price-to-book value of 64.48x further suggests that the stock is trading at a significant premium without corresponding operational performance to justify it.<BR><BR>Overall, while the revenue growth is a positive sign, the continued losses and negative operating margins indicate that the company's financial health is still precarious. Investors should be cautious, as the disconnect between the stock's performance and the company's fundamental challenges could lead to volatility in the future.

View full answer

Is Midwest Gold technically bullish or bearish?

10-Nov-2025

As of November 7, 2025, the trend has shifted to bullish, supported by strong monthly indicators like the MACD and Bollinger Bands, although caution is advised due to mildly bearish weekly signals.

As of 7 November 2025, the technical trend has changed from mildly bullish to bullish. The current stance is bullish with strong indicators supporting this view. The monthly MACD is bullish, and both the Bollinger Bands and Dow Theory are also indicating bullish conditions on both weekly and monthly time frames. Daily moving averages are bullish as well, reinforcing the positive outlook. However, the weekly MACD and KST are mildly bearish, which suggests some caution in the short term. Overall, the strength of the bullish trend is supported by multiple indicators, particularly on the monthly time frame.

View full answer

How has been the historical performance of Midwest Gold?

09-Nov-2025

Midwest Gold has faced significant financial challenges, reporting a net loss of -6.84 crore and a negative operating profit margin of -546.15% as of March 2025, with total liabilities of 204.53 crore and a total debt of 105.96 crore. Despite negative cash flows from operations, the company had a net cash inflow of 39.00 crore from financing activities.

Answer:<BR>The historical performance of Midwest Gold shows significant financial challenges as of March 2025.<BR><BR>Breakdown:<BR>Midwest Gold reported net sales of 0.78 crore with total operating income also at 0.78 crore. The company faced substantial costs, including raw material costs of 0.07 crore and purchases of finished goods amounting to 0.46 crore, leading to a total expenditure of 5.04 crore. This resulted in an operating profit (PBDIT) of -4.26 crore, and after accounting for other income, the operating profit stood at -3.90 crore. The interest expense was 2.37 crore, culminating in a profit before tax of -6.85 crore and a profit after tax of -6.84 crore. The consolidated net profit was reported at -5.60 crore, with an earnings per share (EPS) of -5.07. The company’s operating profit margin was notably negative at -546.15%, and the profit after tax margin was -876.92%. On the balance sheet, total liabilities were 204.53 crore, with total assets matching this figure. The company had a total debt of 105.96 crore and a book value per share of 80.33. Cash flow analysis indicated a net cash inflow of 39.00 crore, primarily driven by financing activities, despite negative cash flows from operating and investing activities.

View full answer

Who are the top shareholders of the Midwest Gold?

17-Jul-2025

The top shareholders of Midwest Gold include Rama Raghava Reddy Kollareddy with 62.74%, followed by individual investors at 21.11%, Musuku Mahender Reddy at 3.62%, and four Foreign Institutional Investors holding 6.62%. Mutual funds hold a minimal 0.04%.

The top shareholders of Midwest Gold include the promoters, with Rama Raghava Reddy Kollareddy holding the largest share at 62.74%. Additionally, there are four Foreign Institutional Investors (FIIs) collectively holding 6.62%, and mutual funds are represented by three schemes with a very small holding of 0.04%. The highest public shareholder is Musuku Mahender Reddy, who owns 3.62%. Individual investors also have a significant presence, holding 21.11% of the shares.

View full answer

Is Midwest Gold overvalued or undervalued?

09-Jun-2025

As of September 22, 2023, Midwest Gold is considered risky and overvalued due to troubling financial ratios, including a PE ratio of -129.90, and despite a year-to-date return of 501.95%, its metrics are significantly worse than peers like MMTC and PTC India.

As of 22 September 2023, the valuation grade for Midwest Gold has moved from does not qualify to risky, indicating increased concerns regarding its financial health. The company appears to be overvalued, particularly given its troubling financial ratios, including a PE ratio of -129.90, an EV to EBIT of -150.30, and an EV to EBITDA of -170.76. These negative figures suggest significant operational challenges that are not being reflected in its current stock price.<BR><BR>In comparison to its peers, Midwest Gold's valuation metrics are starkly unfavorable. For instance, MMTC has a PE ratio of 119.39 and an EV to EBITDA of -70.04, while PTC India, categorized as very attractive, boasts a PE of 9.02 and an EV to EBITDA of 4.14. The stark contrast in these ratios highlights Midwest Gold's overvaluation in the current market context. Additionally, the company has significantly outperformed the Sensex in recent periods, with a year-to-date return of 501.95% compared to the Sensex's 5.64%, which may have contributed to inflated market expectations despite its underlying financial issues.

View full answer

Has Midwest Gold declared dividend?

06-Jun-2025

No Dividend History Available

iScoreScore
Click here to find our call on this stock
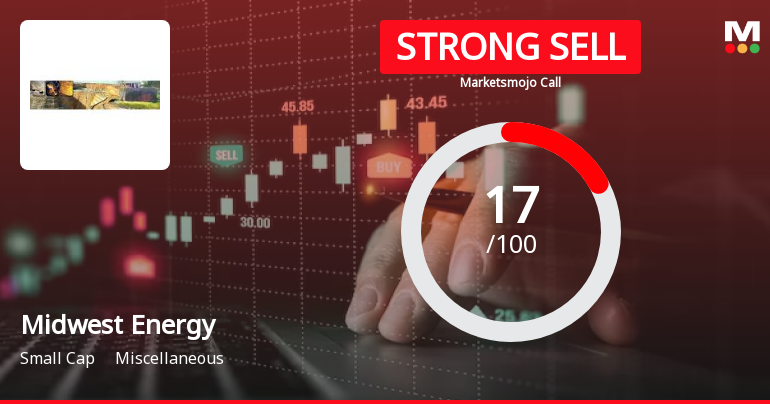
Strong Sell
Sell
Hold
Buy
Strong Buy

Dashboard

1

With a Operating Losses, the company has a Weak Long Term Fundamental Strength

  • Poor long term growth as Operating profit has grown by an annual rate -9.18% of over the last 5 years
  • Company's ability to service its debt is weak with a poor EBIT to Interest (avg) ratio of -1.75
2

Risky - Negative EBITDA

stock-summaryMojo Parameters

Mojo Parameters

Loading Valuation Snapshot...

Stock DNA

stock-summary
Industry

Miscellaneous

stock-summary
Market cap

INR 4,102 Cr (Small Cap)

stock-summary
P/E

NA (Loss Making)

stock-summary
Industry P/E

22

stock-summary
Dividend Yield

0.00%

stock-summary
Debt Equity

-0.17

stock-summary
Return on Equity

0.73%

stock-summary
Price to Book

9.67

Revenue and Profits:
Net Sales:
6 Cr
(Quarterly Results - Mar 2026)
Net Profit:
-3 Cr
stock-summaryTotal Returns
Total Returns (Price + Dividend) stock-summary
Dividend Yield (0%)
TimePeriod
Price Return
Dividend Return
Total Return
3 Months
-21.16%
0%
-21.16%
6 Months
-38.8%
0%
-38.8%
1 Year
94.56%
0%
94.56%
2 Years
6425.0%
0%
6425.0%
3 Years
0%
0%
0.0%
4 Years
0%
0%
0.0%
5 Years
16759.19%
0%
16759.19%

Midwest Energy for the last several years.

Risk Adjusted Returns v/s stock-summary
Returns Beta
Icon
Beta has not been calculated since enough price history is not available
stock-summaryNews & Corporate Actions

News

Midwest Gold Ltd Falls 17.92%: 3 Key Factors Driving the Sharp Decline

Announcements stock-summary

Board Meeting Intimation for Meeting Scheduled To Be Held On Monday August 10 2026.

05-Aug-2026 | Source : BSE

Midwest Energy Ltdhas informed BSE that the meeting of the Board of Directors of the Company is scheduled on 10/08/2026 inter alia to consider and approve Unaudited Financial Results (Standalone and Consolidated) for the quarter ended June 30 2026.

Revised Outcome For Board Meeting Held On 28Th July 2026.

29-Jul-2026 | Source : BSE

Revised submission of the Outcome of the Board meeting dated 28th July 2026 to incorporate the additional disclosure relating to the resignation of the Independent Director as required by Stock Exchange. All other contents of the earlier disclosure remain unchanged.

Board Meeting Outcome for For Meeting Held On July 28 2026- Change In Management

28-Jul-2026 | Source : BSE

The Board of Directors at its meeting held on July 28 2026 inter alia considered and approved/took note of the items as detailed in the attached Outcome of the Board Meeting pursuant to Regulation 30 of the SEBI (LODR) Regulations 2015.

Corporate Actions stock-summary

stock-summary
BOARD MEETING

(10 Aug 2026)

stock-summary
DIVIDEND

No Dividend history available

stock-summary
SPLITS

No Splits history available

stock-summary
BONUS

No Bonus history available

stock-summary
RIGHTS

No Rights history available

stock-summaryKey Factors

Quality key factors stock-summary

Factor
Value
Sales Growth (5y)
90.52%
EBIT Growth (5y)
-9.18%
EBIT to Interest (avg)
-1.75
Debt to EBITDA (avg)
Negative Net Debt
Net Debt to Equity (avg)
-0.17
Sales to Capital Employed (avg)
0.15
Tax Ratio
0
Dividend Payout Ratio
0
Pledged Shares
0
Institutional Holding
14.21%
ROCE (avg)
-34.43%
ROE (avg)
0.15%

Valuation key factors

Factor
Value
P/E Ratio
NA (Loss Making)
Industry P/E
22
Price to Book Value
9.67
EV to EBIT
-2367.03
EV to EBITDA
-2514.97
EV to Capital Employed
11.46
EV to Sales
164.44
PEG Ratio
7.99
Dividend Yield
NA
ROCE (Latest)
-0.48%
ROE (Latest)
0.73%

Technicals key factors

Indicator
Weekly
Monthly
MACD
Bearish
Mildly Bearish
RSI
No Signal
No Signal
Bollinger Bands
Bearish
Mildly Bullish
Moving Averages
Bearish (Daily)
KST
Bearish
Mildly Bearish
Dow Theory
Mildly Bearish
Mildly Bearish
OBV
No Trend
No Trend
stock-summary Technical Indicator Scale: Bearish, Mildly Bearish, Sideways, Mildly Bullish, Bullish  Turned 
stock-summaryShareholding
Shareholding Snapshot : Jun 2026stock-summary
Shareholding Compare (%holding) stock-summary
Majority shareholders

Promoters

Pledged Promoter Holdings

None

Mutual Funds

Held by 3 Schemes (0.03%)

FIIs

Held by 6 FIIs (12.63%)

Promoter with highest holding

Rama Raghava Reddy Kollareddy (49.23%)

Highest Public shareholder

India Emerging Giants Fund Limited (5.41%)

Individual Investors Holdings

21.96%

stock-summaryFinancial
[
  {
    "link": "quarterly",
    "btn_text": "All Quarterly Results",
    "header": "Quarterly Results Snapshot (Standalone) - Mar'26 - YoY",
    "rhs": [
      {
        "prefix": "Net Sales ",
        "suffix": "YoY Growth in quarter ended Mar 2026 is 550.79% vs -13.70% in Mar 2025",
        "dir": 1
      },
      {
        "prefix": "Standalone Net Profit ",
        "suffix": "YoY Growth in quarter ended Mar 2026 is 111.17% vs -194.03% in Mar 2025",
        "dir": 1
      }
    ],
    "table": {
      "header": [
        "Mar'26",
        "Mar'25",
        "Change(%)"
      ],
      "body": [
        {
          "field": "Net Sales",
          "val1": "4.10",
          "val2": "0.63",
          "chgp": "550.79%",
          "chgp_class": "positive"
        },
        {
          "field": "Operating Profit (PBDIT) excl Other Income",
          "val1": "-1.28",
          "val2": "-1.96",
          "chgp": "34.69%",
          "chgp_class": "positive"
        },
        {
          "field": "Interest",
          "val1": "0.50",
          "val2": "0.60",
          "chgp": "-16.67%",
          "chgp_class": "positive"
        },
        {
          "field": "Exceptional Items",
          "val1": "0.00",
          "val2": "0.00",
          "chgp": "",
          "chgp_class": "neutral"
        },
        {
          "field": "Standalone Net Profit",
          "val1": "0.22",
          "val2": "-1.97",
          "chgp": "111.17%",
          "chgp_class": "positive"
        },
        {
          "field": "Operating Profit Margin (Excl OI)",
          "val1": "-31.22%",
          "val2": "-311.11%",
          "chgp": "279.89%",
          "chgp_class": "positive"
        }
      ]
    }
  },
  {
    "link": "half-yearly",
    "btn_text": "All Half Yearly Results",
    "header": "Half Yearly Results Snapshot (Standalone) - Sep'25",
    "rhs": [
      {
        "prefix": "Net Sales ",
        "suffix": " Growth in half year ended Sep 2025 is 0.00% vs -96.77% in Sep 2024",
        "dir": 1
      },
      {
        "prefix": "Standalone Net Profit ",
        "suffix": " Growth in half year ended Sep 2025 is 247.83% vs 19.30% in Sep 2024",
        "dir": 1
      }
    ],
    "table": {
      "header": [
        "Sep'25",
        "Sep'24",
        "Change(%)"
      ],
      "body": [
        {
          "field": "Net Sales",
          "val1": "0.01",
          "val2": "0.01",
          "chgp": "",
          "chgp_class": "neutral"
        },
        {
          "field": "Operating Profit (PBDIT) excl Other Income",
          "val1": "-0.41",
          "val2": "-0.36",
          "chgp": "-13.89%",
          "chgp_class": "negative"
        },
        {
          "field": "Interest",
          "val1": "1.45",
          "val2": "0.66",
          "chgp": "119.70%",
          "chgp_class": "negative"
        },
        {
          "field": "Exceptional Items",
          "val1": "0.00",
          "val2": "0.00",
          "chgp": "",
          "chgp_class": "neutral"
        },
        {
          "field": "Standalone Net Profit",
          "val1": "1.36",
          "val2": "-0.92",
          "chgp": "247.83%",
          "chgp_class": "positive"
        },
        {
          "field": "Operating Profit Margin (Excl OI)",
          "val1": "-4,100.00%",
          "val2": "-3,600.00%",
          "chgp": "-500.00%",
          "chgp_class": "negative"
        }
      ]
    }
  },
  {
    "link": "nine-monthly",
    "btn_text": "All Nine Monthly Results",
    "header": "Nine Monthly Results Snapshot (Standalone) - Dec'25",
    "rhs": [
      {
        "prefix": "Net Sales ",
        "suffix": "YoY Growth in nine months ended Dec 2025 is 7,444.44% vs -12.90% in Dec 2024",
        "dir": 1
      },
      {
        "prefix": "Standalone Net Profit ",
        "suffix": "YoY Growth in nine months ended Dec 2025 is 241.38% vs -24.54% in Dec 2024",
        "dir": 1
      }
    ],
    "table": {
      "header": [
        "Dec'25",
        "Dec'24",
        "Change(%)"
      ],
      "body": [
        {
          "field": "Net Sales",
          "val1": "20.37",
          "val2": "0.27",
          "chgp": "7,444.44%",
          "chgp_class": "positive"
        },
        {
          "field": "Operating Profit (PBDIT) excl Other Income",
          "val1": "-0.32",
          "val2": "-0.90",
          "chgp": "64.44%",
          "chgp_class": "positive"
        },
        {
          "field": "Interest",
          "val1": "2.04",
          "val2": "1.60",
          "chgp": "27.50%",
          "chgp_class": "negative"
        },
        {
          "field": "Exceptional Items",
          "val1": "0.00",
          "val2": "0.00",
          "chgp": "",
          "chgp_class": "neutral"
        },
        {
          "field": "Standalone Net Profit",
          "val1": "2.87",
          "val2": "-2.03",
          "chgp": "241.38%",
          "chgp_class": "positive"
        },
        {
          "field": "Operating Profit Margin (Excl OI)",
          "val1": "-1.57%",
          "val2": "-333.33%",
          "chgp": "331.76%",
          "chgp_class": "positive"
        }
      ]
    }
  },
  {
    "link": "annual",
    "btn_text": "All Annual Results",
    "header": "Annual Results Snapshot (Standalone) - Mar'26",
    "rhs": [
      {
        "prefix": "Net Sales ",
        "suffix": "YoY Growth in year ended Mar 2026 is 2,587.91% vs -13.33% in Mar 2025",
        "dir": 1
      },
      {
        "prefix": "Standalone Net Profit ",
        "suffix": "YoY Growth in year ended Mar 2026 is 192.11% vs -32.17% in Mar 2025",
        "dir": 1
      }
    ],
    "table": {
      "header": [
        "Mar'26",
        "Mar'25",
        "Change(%)"
      ],
      "body": [
        {
          "field": "Net Sales",
          "val1": "24.46",
          "val2": "0.91",
          "chgp": "2,587.91%",
          "chgp_class": "positive"
        },
        {
          "field": "Operating Profit (PBDIT) excl Other Income",
          "val1": "-2.02",
          "val2": "-3.62",
          "chgp": "44.20%",
          "chgp_class": "positive"
        },
        {
          "field": "Interest",
          "val1": "2.58",
          "val2": "2.20",
          "chgp": "17.27%",
          "chgp_class": "negative"
        },
        {
          "field": "Exceptional Items",
          "val1": "0.00",
          "val2": "0.00",
          "chgp": "",
          "chgp_class": "neutral"
        },
        {
          "field": "Standalone Net Profit",
          "val1": "2.80",
          "val2": "-3.04",
          "chgp": "192.11%",
          "chgp_class": "positive"
        },
        {
          "field": "Operating Profit Margin (Excl OI)",
          "val1": "-8.26%",
          "val2": "-397.80%",
          "chgp": "389.54%",
          "chgp_class": "positive"
        }
      ]
    }
  }
]

Quarterly Results Snapshot (Standalone) - Mar'26 - YoYstock-summary

Mar'26
Mar'25
Change(%)
Net Sales
4.10
0.63
550.79%
Operating Profit (PBDIT) excl Other Income
-1.28
-1.96
34.69%
Interest
0.50
0.60
-16.67%
Exceptional Items
0.00
0.00
Standalone Net Profit
0.22
-1.97
111.17%
Operating Profit Margin (Excl OI)
-31.22%
-311.11%
279.89%
Values in Rs Cr.
Direction Arrows
Net Sales

YoY Growth in quarter ended Mar 2026 is 550.79% vs -13.70% in Mar 2025

Direction Arrows
Standalone Net Profit

YoY Growth in quarter ended Mar 2026 is 111.17% vs -194.03% in Mar 2025

Half Yearly Results Snapshot (Standalone) - Sep'25stock-summary

Sep'25
Sep'24
Change(%)
Net Sales
0.01
0.01
Operating Profit (PBDIT) excl Other Income
-0.41
-0.36
-13.89%
Interest
1.45
0.66
119.70%
Exceptional Items
0.00
0.00
Standalone Net Profit
1.36
-0.92
247.83%
Operating Profit Margin (Excl OI)
-4,100.00%
-3,600.00%
-500.00%
Values in Rs Cr.
Direction Arrows
Net Sales

Growth in half year ended Sep 2025 is 0.00% vs -96.77% in Sep 2024

Direction Arrows
Standalone Net Profit

Growth in half year ended Sep 2025 is 247.83% vs 19.30% in Sep 2024

Nine Monthly Results Snapshot (Standalone) - Dec'25stock-summary

Dec'25
Dec'24
Change(%)
Net Sales
20.37
0.27
7,444.44%
Operating Profit (PBDIT) excl Other Income
-0.32
-0.90
64.44%
Interest
2.04
1.60
27.50%
Exceptional Items
0.00
0.00
Standalone Net Profit
2.87
-2.03
241.38%
Operating Profit Margin (Excl OI)
-1.57%
-333.33%
331.76%
Values in Rs Cr.
Direction Arrows
Net Sales

YoY Growth in nine months ended Dec 2025 is 7,444.44% vs -12.90% in Dec 2024

Direction Arrows
Standalone Net Profit

YoY Growth in nine months ended Dec 2025 is 241.38% vs -24.54% in Dec 2024

Annual Results Snapshot (Standalone) - Mar'26stock-summary

Mar'26
Mar'25
Change(%)
Net Sales
24.46
0.91
2,587.91%
Operating Profit (PBDIT) excl Other Income
-2.02
-3.62
44.20%
Interest
2.58
2.20
17.27%
Exceptional Items
0.00
0.00
Standalone Net Profit
2.80
-3.04
192.11%
Operating Profit Margin (Excl OI)
-8.26%
-397.80%
389.54%
Values in Rs Cr.
Direction Arrows
Net Sales

YoY Growth in year ended Mar 2026 is 2,587.91% vs -13.33% in Mar 2025

Direction Arrows
Standalone Net Profit

YoY Growth in year ended Mar 2026 is 192.11% vs -32.17% in Mar 2025

stock-summaryCompany CV
About Midwest Energy Ltd stock-summary
stock-summary
Midwest Energy Ltd
Small Cap
Miscellaneous
Midwest Gold Ltd. (Formerly known as Nova Granites (India) Ltd) was originally incorporated as a Limited Company in November, 1990 in Karnataka. The Company was incorporated as 100 % EOU with an object of processing of Granite Blocks including mining and processing of all other types of minerals. The Company is presently engaged in the trading business of Granite, Marbles. The Company commenced its commercial operations in year 1990.
Company Coordinates stock-summary
Company Details
No 25 A Attibele Indust Area, Attibele Bangalore Karnataka : 562107
stock-summary
Tel: 91-80-27820407
stock-summary
novagranites1990@gmail.com
Registrar Details
Bigshare Services Pvt Ltd , G 10 Left Wing Amruta Village , Opp: Yashoda Hospital, Raj Bhavan Road, Somajiguda, Hyderabad