Milkfood

INR
84.97
0.00 (0.00%)
BSENSE

Sep 09, 03:30 PM

BSE+NSE Vol: 2.29 k

  • Price Points
  • Score
  • Mojo Parameters
  • Total Return
  • News and Corporate Actions
  • Key factors
  • Shareholding
  • Financials
  • CompanyCV
stock-summaryPrice Point
High/Low

1Day

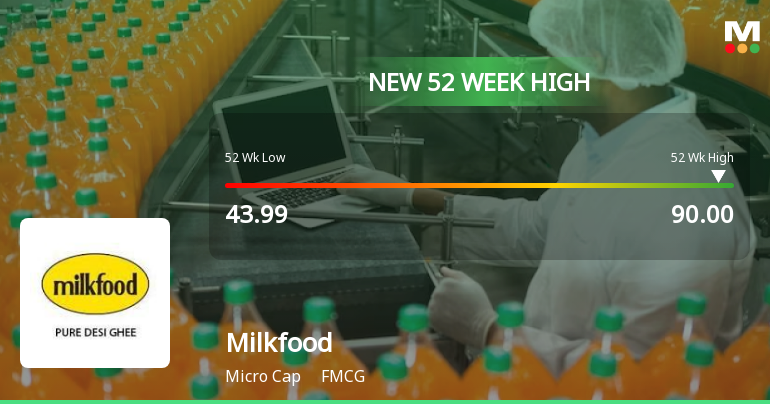
52 Week

Valuation
Technical
Day's Volume

CASH

2.29 k (658.95%) Volume

Shareholding (Jun 2026)

FII

0.00%

Held by 0 FIIs

DII

0.02%

Held by 0 DIIs

Promoter

53.37%

Why is Milkfood Ltd falling/rising?

06-Sep-2026

As of 05-Sep, Milkfood Ltd's stock price is rising to Rs 85.00, up 2.41%, due to strong relative performance and a trend reversal after previous declines. Despite reduced investor participation, the stock remains liquid and is above key moving averages, indicating a positive trend.

As of 05-Sep, Milkfood Ltd's stock price is rising, currently at Rs 85.00, reflecting an increase of Rs 2.0 or 2.41%. This upward movement can be attributed to several factors. Firstly, the stock has outperformed its sector by 2.59% today, indicating strong relative performance. Additionally, it has experienced a trend reversal after three consecutive days of decline, suggesting a positive shift in market sentiment. The stock opened with a gain of 2.35% today and reached an intraday high of Rs 85, reinforcing the bullish momentum.<BR><BR>Moreover, despite a recent drop in investor participation, with delivery volume falling by 70% against the 5-day average, the stock remains liquid enough for trading, which may attract investors looking for opportunities. The current price is also higher than the 20-day, 50-day, 100-day, and 200-day moving averages, indicating a generally positive trend in the stock's performance over these periods. Overall, these factors contribute to the rising price of Milkfood Ltd's stock.

View full answer

Who are in the management team of Milkfood?

01-Sep-2026

The management team of Milkfood includes Sudhir Avasthi (Managing Director), Preeti Mathur, Harmesh Mohan Sood (Directors), Gita Bawa, Kewal Krishan Kohli, Anil Girotra (Independent Directors), Namita Swain (Non-Executive Director), and Rakesh Kumar Thakur (Company Secretary & Compliance Officer). This diverse team contributes to the company's governance and strategic direction.

The management team of Milkfood includes the following individuals:<BR><BR>1. **Sudhir Avasthi** - Managing Director<BR>2. **Preeti Mathur** - Director<BR>3. **Harmesh Mohan Sood** - Director<BR>4. **Gita Bawa** - Independent Director<BR>5. **Kewal Krishan Kohli** - Independent Director<BR>6. **Anil Girotra** - Independent Director<BR>7. **Namita Swain** - Non-Executive Director<BR>8. **Rakesh Kumar Thakur** - Company Secretary & Compliance Officer<BR><BR>This team brings a diverse range of expertise to the company, contributing to its governance and strategic direction.

View full answer

What does Milkfood do?

01-Sep-2026

Milkfood Ltd is a Punjab-based FMCG company that manufactures and sells dairy products. As of June 2026, it reported net sales of ₹81 Cr and a market cap of ₹225 Cr, but is currently loss-making with a net profit of ₹0 Cr.

Overview:<BR>Milkfood Ltd is a Punjab-based company operating in the FMCG sector, primarily engaged in the manufacture and sale of dairy products.<BR><BR>History:<BR>Milkfood Ltd was incorporated in March 1973 and is controlled by the Jaiswal family through L P Investments, a subsidiary of Jagatjit Industries. The latest quarterly results reported net sales and net profit for June 2026.<BR><BR>Financial Snapshot:<BR>- Net Sales: 81 Cr (Quarterly Results - Jun 2026)<BR>- Net Profit: 0 Cr (Quarterly Results - Jun 2026)<BR>- Market cap: INR 225 Cr (Micro Cap)<BR><BR>Key Metrics:<BR>- P/E: N/A (Loss Making)<BR>- Industry P/E: 44<BR>- Dividend Yield: 0.00%<BR>- Debt Equity: 0.76<BR>- Return on Equity: -3.26%<BR>- Price to Book: 1.30<BR><BR>Contact Details:<BR>Address: Bahadurgarh, Patiala Punjab: 147021<BR>Tel: 91-0175-2381404<BR>Email: milkfoodltd@milkfoodltd.com<BR>Website: http://www.milkfoodltd.com

View full answer

Who are the peers of the Milkfood?

01-Sep-2026

Milkfood's peers include Wardwizard Foods, Aveer Foods, Indo National, and others, with varying management risks and growth rates. Wardwizard Foods leads in 1-year returns at 104.57%, while Milkfood has a return of 20.53%.

Peers: The peers of Milkfood are Wardwizard Foods, Aveer Foods, Indo National, Gillanders Arbut, Neelamalai Agro, Rossell India, Gujjubhai Indust, United Nilgiri, The Peria Karama.<BR><BR>Quality Snapshot: Excellent management risk is observed at Gujjubhai Indust, while Average management risk is found at Milkfood, Neelamalai Agro, Rossell India, United Nilgiri, and The Peria Karama. Below Average management risk is noted for Wardwizard Foods, Aveer Foods, Indo National, Gillanders Arbut, and the rest. Growth is excellent at Gujjubhai Indust, while Average growth is seen at Milkfood, Neelamalai Agro, Rossell India, United Nilgiri, and The Peria Karama. Below Average growth is present in Wardwizard Foods, Aveer Foods, Indo National, Gillanders Arbut, and the rest. Capital Structure is excellent at Gujjubhai Indust and United Nilgiri, while Average capital structure is found at Rossell India. Below Average capital structure is noted for Milkfood, Indo National, Gillanders Arbut, Aveer Foods, and the rest.<BR><BR>Return Snapshot: The peer with the highest 1-year return is Wardwizard Foods at 104.57%, while the lowest is Aveer Foods at -28.63%. Milkfood's 1-year return of 20.53% is higher than Aveer Foods but lower than Wardwizard Foods. Additionally, Gujjubhai Indust, Aveer Foods, Indo National, and Gujjubhai Indust have negative six-month returns.

View full answer

How big is Milkfood?

01-Sep-2026

As of 31st August, Milkfood Ltd has a market capitalization of 225.00 Cr and reported net sales of 419.02 Cr with a loss of 5.51 Cr over the latest four quarters. Shareholder's funds are 176.23 Cr, and total assets are valued at 375.15 Cr.

As of 31st August, Milkfood Ltd has a market capitalization of 225.00 Cr, categorizing it as a Micro Cap company.<BR><BR>In the latest four quarters, Milkfood reported net sales of 419.02 Cr. However, the company experienced a loss of 5.51 Cr during the same period.<BR><BR>The latest annual reporting period for the balance sheet is March 2025. Shareholder's funds stood at 176.23 Cr, while total assets were valued at 375.15 Cr.

View full answer

Should I buy, sell or hold Milkfood Ltd?

19-Aug-2026

When is the next results date for Milkfood Ltd?

15-May-2026

The next results date for Milkfood Ltd is 22 May 2026.

The next results date for Milkfood Ltd is scheduled for 22 May 2026.

View full answer

Is Milkfood overvalued or undervalued?

19-Nov-2025

As of November 18, 2025, Milkfood's valuation has shifted from very attractive to attractive, with key ratios indicating overvaluation, including a PE Ratio of -31.11 and an EV to EBITDA of 35.85, while its stock has underperformed the Sensex with a year-to-date return of -37.77%.

As of 18 November 2025, the valuation grade for Milkfood has moved from very attractive to attractive. The company is currently assessed as overvalued. Key ratios include a PE Ratio of -31.11, an EV to EBITDA of 35.85, and a Price to Book Value of 1.01. <BR><BR>In comparison to its peers, Milkfood's PE Ratio is significantly lower than Hindustan Unilever's 53.39 and Nestle India's 81.48, both of which are classified as very expensive. Additionally, Milkfood's EV to EBITDA ratio is higher than the industry average, indicating potential overvaluation. The company's stock has underperformed relative to the Sensex, with a year-to-date return of -37.77% compared to the Sensex's 8.36%, reinforcing the overvaluation narrative.

View full answer

Are Milkfood latest results good or bad?

18-Nov-2025

Milkfood's latest results are concerning, showing a net loss of ₹7.86 crores in Q2 FY26, a 973.33% decline year-on-year, with negative operating and profit margins. The company faces significant operational challenges and has been rated a "STRONG SELL" by the market.

Milkfood's latest results indicate a troubling financial situation. In the second quarter of FY26, the company reported a net loss of ₹7.86 crores, which is a drastic decline of 973.33% year-on-year. This marks a significant deterioration from the previous quarter, where the loss was only ₹0.69 crores. <BR><BR>Net sales for the quarter stood at ₹74.05 crores, reflecting a 7.90% decrease compared to the same period last year. The operating margin has also turned negative, with a margin of -3.15%, a stark contrast to the 7.44% margin reported in the same quarter last year. Additionally, the profit after tax (PAT) margin is at -10.61%, indicating deep losses.<BR><BR>The company's operational challenges are compounded by rising interest costs, which increased by 9.75% year-on-year. This has led to an operating profit to interest coverage ratio of -0.67 times, suggesting that Milkfood is unable to cover its interest obligations from its operational cash flows.<BR><BR>Overall, the financial performance shows a significant decline in profitability, with multiple red flags indicating serious operational and financial challenges. The company has been rated as a "STRONG SELL," reflecting the market's lack of confidence in its ability to recover.

View full answer

How has been the historical performance of Milkfood?

17-Nov-2025

Milkfood's historical performance has shown fluctuations, with net sales peaking at 551.41 Cr in Mar'20 and declining to 447.76 Cr in Mar'25, alongside decreasing profitability metrics and increased total assets and liabilities. Overall, the company has faced challenges in maintaining consistent sales and profit margins.

Answer:<BR>The historical performance of Milkfood shows fluctuations in key financial metrics over the years, with notable trends in net sales, profit margins, and overall profitability.<BR><BR>Breakdown:<BR>Milkfood's net sales have varied significantly, peaking at 551.41 Cr in Mar'20 before declining to 447.76 Cr in Mar'25. The total operating income followed a similar trend, reaching a high of 551.41 Cr in Mar'20 and dropping to 447.76 Cr in Mar'25. Raw material costs have also fluctuated, with a notable increase to 374.57 Cr in Mar'25 from 328.09 Cr in Mar'24. Operating profit (PBDIT) has shown some volatility, with a peak of 29.07 Cr in Mar'24 and a slight decrease to 25.50 Cr in Mar'25. Profit before tax has declined from 11.49 Cr in Mar'23 to 7.57 Cr in Mar'25, while profit after tax also decreased from 9.75 Cr in Mar'23 to 4.51 Cr in Mar'25. The company's total assets have increased from 300.17 Cr in Mar'20 to 375.15 Cr in Mar'25, indicating growth in the asset base, while total liabilities have also risen, reaching 112.99 Cr in Mar'25. Cash flow from operating activities has shown a decline, with a cash flow of 20.00 Cr in Mar'24 compared to a negative cash flow of -30.00 Cr in Mar'23. Overall, Milkfood's financial performance reflects a challenging environment with fluctuating sales and profitability metrics over the years.

View full answer

What is the technical trend for Milkfood?

09-Jun-2025

As of May 9, 2025, Milkfood's technical trend is mildly bearish, influenced by daily moving averages and a bearish monthly MACD, despite some mildly bullish signals on the weekly MACD and KST.

As of 9 May 2025, the technical trend for Milkfood has changed from bearish to mildly bearish. The weekly MACD indicates a mildly bullish stance, while the monthly MACD remains bearish. The moving averages on the daily chart are also mildly bearish. Bollinger Bands reflect a mildly bearish trend on both weekly and monthly time frames. The KST shows a mildly bullish signal weekly but is bearish monthly, and Dow Theory indicates a mildly bullish trend on the weekly chart with no trend on the monthly. Overall, the current technical stance is mildly bearish, driven primarily by the daily moving averages and the monthly MACD.

View full answer

Who are the top shareholders of the Milkfood?

06-Jun-2025

The top shareholders of Milkfood are Mr. Karamjit Jaiswal with 43.76%, Dhanvani Investments Private Limited at 9.2%, and individual investors holding 17.46%. There are also three mutual fund schemes with a combined 0.02%, and no foreign institutional investors are currently involved.

The top shareholders of Milkfood include Mr. Karamjit Jaiswal, who is the promoter with the highest holding at 43.76%. The next significant shareholder is Dhanvani Investments Private Limited, holding 9.2%. Additionally, individual investors collectively own 17.46% of the company. There are also three mutual fund schemes that hold a very small portion, at 0.02%, while there are currently no foreign institutional investors (FIIs) involved.

View full answer

What is the bonus history of the Milkfood?

06-Jun-2025

Milkfood Ltd has announced a 1:1 bonus issue, with an ex-date of August 13, 2024, meaning shareholders will receive one additional share for each share they own as of that date.

Milkfood Ltd has a recent bonus issue history where they announced a 1:1 bonus issue. The ex-date for this bonus is set for August 13, 2024. This means that shareholders will receive one additional share for every share they own as of that date. If you have any more questions about Milkfood or its financial activities, feel free to ask!

View full answer

Has Milkfood declared dividend?

06-Jun-2025

Yes, Milkfood Ltd has declared a 25% dividend, amounting to ₹2.5 per share, with an ex-date of July 5, 2024. However, the company has experienced significant price declines over various periods, resulting in negative total returns despite the dividend.

Milkfood Ltd has declared a 25% dividend.<BR><BR>Dividend Details:<BR>- Percentage announced: 25%<BR>- Amount per share: 2.5<BR>- Ex-date: 05 Jul 24<BR><BR>Dividend Yield: 0.63%<BR><BR>Total Returns by Period:<BR>In the last 6 months, the price return was -28.36%, with no dividend return, resulting in a total return of -28.36%.<BR><BR>Over the past year, the price return was -37.27%, with a dividend return of 1.87%, leading to a total return of -35.4%.<BR><BR>In the 2-year period, the price return was -42.68%, while the dividend return was 3.51%, culminating in a total return of -39.17%.<BR><BR>For the 3-year period, the price return was -9.44%, with a dividend return of 8.45%, resulting in a total return of -0.99%.<BR><BR>In the 4-year timeframe, the price return was -6.43%, the dividend return was 8.21%, and the total return was 1.78%.<BR><BR>Over the last 5 years, the price return was -16.97%, with a dividend return of 7.46%, leading to a total return of -9.51%.<BR><BR>Overall, while Milkfood has declared a dividend, the total returns over various periods indicate significant declines in price, suggesting challenges in the company's performance despite the dividend announcements.

View full answer
iScoreScore
Click here to find our call on this stock
Strong Sell
Sell
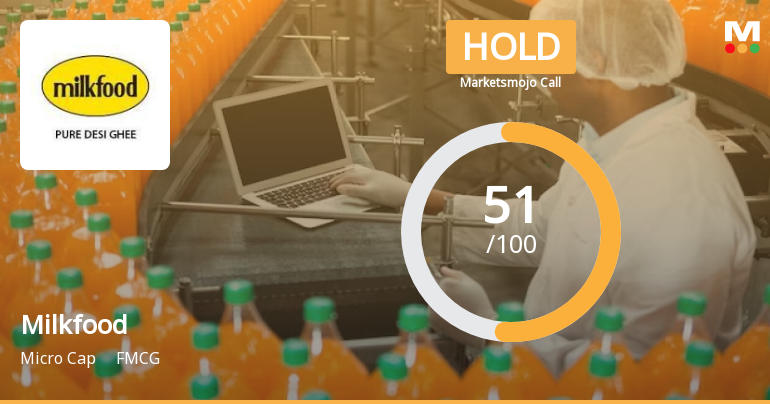
Hold
Buy
Strong Buy

Dashboard

1

Weak Long Term Fundamental Strength with a -14.40% CAGR growth in Operating Profits over the last 5 years

  • Low ability to service debt as the company has a high Debt to EBITDA ratio of 17.39 times
  • The company has been able to generate a Return on Equity (avg) of 3.20% signifying low profitability per unit of shareholders funds
2

The company has declared positive results in Jun'2026 after 4 consecutive negative quarters

3

With ROCE of 0.2, it has a Expensive valuation with a 1.2 Enterprise value to Capital Employed

4

Promoter holding has decreased this quarter and now hold 53.37% of the company

 
stock-summaryMojo Parameters

Mojo Parameters

Loading Valuation Snapshot...

Stock DNA

stock-summary
Industry

FMCG

stock-summary
Market cap

INR Cr (Micro Cap)

stock-summary
P/E

NA (Loss Making)

stock-summary
Industry P/E

NA

stock-summary
Dividend Yield

0.00%

stock-summary
Debt Equity

0.00

stock-summary
Return on Equity

0.00%

stock-summary
Price to Book

0.00

Revenue and Profits:
Net Sales:
81 Cr
(Quarterly Results - Jun 2026)
Net Profit:
0 Cr
stock-summaryTotal Returns
Total Returns (Price + Dividend) stock-summary
Icon
Company does not have enough history
Risk Adjusted Returns v/s stock-summary
Returns Beta
Icon
Beta has not been calculated since enough price history is not available
stock-summaryNews & Corporate Actions

News

stock-summaryKey Factors

Quality key factors stock-summary

Factor
Value
Sales Growth (5y)
3.24%
EBIT Growth (5y)
-14.40%
EBIT to Interest (avg)
0.97
Debt to EBITDA (avg)
7.52
Net Debt to Equity (avg)
0.76
Sales to Capital Employed (avg)
1.59
Tax Ratio
74.92%
Dividend Payout Ratio
67.42%
Pledged Shares
0
Institutional Holding
0.02%
ROCE (avg)
4.05%
ROE (avg)
3.20%

Valuation key factors

Factor
Value
P/E Ratio
NA (Loss Making)
Industry P/E
43
Price to Book Value
1.30
EV to EBIT
346.86
EV to EBITDA
41.54
EV to Capital Employed
1.17
EV to Sales
0.83
PEG Ratio
NA
Dividend Yield
NA
ROCE (Latest)
0.16%
ROE (Latest)
-3.26%

Technicals key factors

Indicator
Weekly
Monthly
MACD
Bullish
Mildly Bullish
RSI
No Signal
No Signal
Bollinger Bands
Bullish
Mildly Bullish
Moving Averages
Bullish (Daily)
KST
Bullish
Mildly Bullish
Dow Theory
No Trend
No Trend
OBV
No Trend
No Trend
stock-summary Technical Indicator Scale: Bearish, Mildly Bearish, Sideways, Mildly Bullish, Bullish  Turned 
stock-summaryShareholding
Shareholding Snapshot : Jun 2026stock-summary
Shareholding Compare (%holding) stock-summary
Majority shareholders

Promoters

Pledged Promoter Holdings

None

Mutual Funds

Held by 3 Schemes (0.02%)

FIIs

Held by 0 FIIs

Promoter with highest holding

Karamjit Jaiswal (41.67%)

Highest Public shareholder

Dhanvani Investments Private Limited (8.76%)

Individual Investors Holdings

17.5%

stock-summaryFinancial
[
  {
    "link": "quarterly",
    "btn_text": "All Quarterly Results",
    "header": "Quarterly Results Snapshot (Standalone) - Jun'26 - YoY",
    "rhs": [
      {
        "prefix": "Net Sales ",
        "suffix": "YoY Growth in quarter ended Jun 2026 is 10.26% vs -23.31% in Jun 2025",
        "dir": 1
      },
      {
        "prefix": "Standalone Net Profit ",
        "suffix": "YoY Growth in quarter ended Jun 2026 is 131.88% vs -216.95% in Jun 2025",
        "dir": 1
      }
    ],
    "table": {
      "header": [
        "Jun'26",
        "Jun'25",
        "Change(%)"
      ],
      "body": [
        {
          "field": "Net Sales",
          "val1": "81.22",
          "val2": "73.66",
          "chgp": "10.26%",
          "chgp_class": "positive"
        },
        {
          "field": "Operating Profit (PBDIT) excl Other Income",
          "val1": "3.47",
          "val2": "-1.06",
          "chgp": "427.36%",
          "chgp_class": "positive"
        },
        {
          "field": "Interest",
          "val1": "2.25",
          "val2": "3.22",
          "chgp": "-30.12%",
          "chgp_class": "positive"
        },
        {
          "field": "Exceptional Items",
          "val1": "-0.23",
          "val2": "0.00",
          "chgp": "",
          "chgp_class": "neutral"
        },
        {
          "field": "Standalone Net Profit",
          "val1": "0.22",
          "val2": "-0.69",
          "chgp": "131.88%",
          "chgp_class": "positive"
        },
        {
          "field": "Operating Profit Margin (Excl OI)",
          "val1": "4.27%",
          "val2": "-1.44%",
          "chgp": "5.71%",
          "chgp_class": "positive"
        }
      ]
    }
  },
  {
    "link": "half-yearly",
    "btn_text": "All Half Yearly Results",
    "header": "Half Yearly Results Snapshot (Consolidated) - Sep'25",
    "rhs": [
      {
        "prefix": "Net Sales ",
        "suffix": " Growth in half year ended Sep 2025 is -16.29% vs -11.89% in Sep 2024",
        "dir": -1
      },
      {
        "prefix": "Consolidated Net Profit ",
        "suffix": " Growth in half year ended Sep 2025 is -673.15% vs -28.02% in Sep 2024",
        "dir": -1
      }
    ],
    "table": {
      "header": [
        "Sep'25",
        "Sep'24",
        "Change(%)"
      ],
      "body": [
        {
          "field": "Net Sales",
          "val1": "147.71",
          "val2": "176.45",
          "chgp": "-16.29%",
          "chgp_class": "negative"
        },
        {
          "field": "Operating Profit (PBDIT) excl Other Income",
          "val1": "-3.39",
          "val2": "11.87",
          "chgp": "-128.56%",
          "chgp_class": "negative"
        },
        {
          "field": "Interest",
          "val1": "6.71",
          "val2": "6.40",
          "chgp": "4.84%",
          "chgp_class": "negative"
        },
        {
          "field": "Exceptional Items",
          "val1": "0.00",
          "val2": "0.00",
          "chgp": "",
          "chgp_class": "neutral"
        },
        {
          "field": "Consolidate Net Profit",
          "val1": "-8.54",
          "val2": "1.49",
          "chgp": "-673.15%",
          "chgp_class": "negative"
        },
        {
          "field": "Operating Profit Margin (Excl OI)",
          "val1": "-2.30%",
          "val2": "6.73%",
          "chgp": "-9.03%",
          "chgp_class": "negative"
        }
      ]
    }
  },
  {
    "link": "nine-monthly",
    "btn_text": "All Nine Monthly Results",
    "header": "Nine Monthly Results Snapshot (Standalone) - Dec'25",
    "rhs": [
      {
        "prefix": "Net Sales ",
        "suffix": "YoY Growth in nine months ended Dec 2025 is -19.24% vs -8.09% in Dec 2024",
        "dir": -1
      },
      {
        "prefix": "Standalone Net Profit ",
        "suffix": "YoY Growth in nine months ended Dec 2025 is -436.79% vs -34.57% in Dec 2024",
        "dir": -1
      }
    ],
    "table": {
      "header": [
        "Dec'25",
        "Dec'24",
        "Change(%)"
      ],
      "body": [
        {
          "field": "Net Sales",
          "val1": "234.00",
          "val2": "289.73",
          "chgp": "-19.24%",
          "chgp_class": "negative"
        },
        {
          "field": "Operating Profit (PBDIT) excl Other Income",
          "val1": "3.04",
          "val2": "15.31",
          "chgp": "-80.14%",
          "chgp_class": "negative"
        },
        {
          "field": "Interest",
          "val1": "10.38",
          "val2": "7.56",
          "chgp": "37.30%",
          "chgp_class": "negative"
        },
        {
          "field": "Exceptional Items",
          "val1": "0.00",
          "val2": "0.00",
          "chgp": "",
          "chgp_class": "neutral"
        },
        {
          "field": "Standalone Net Profit",
          "val1": "-7.14",
          "val2": "2.12",
          "chgp": "-436.79%",
          "chgp_class": "negative"
        },
        {
          "field": "Operating Profit Margin (Excl OI)",
          "val1": "1.30%",
          "val2": "5.28%",
          "chgp": "-3.98%",
          "chgp_class": "negative"
        }
      ]
    }
  },
  {
    "link": "annual",
    "btn_text": "All Annual Results",
    "header": "Annual Results Snapshot (Standalone) - Mar'26",
    "rhs": [
      {
        "prefix": "Net Sales ",
        "suffix": "YoY Growth in year ended Mar 2026 is -7.78% vs 2.48% in Mar 2025",
        "dir": -1
      },
      {
        "prefix": "Standalone Net Profit ",
        "suffix": "YoY Growth in year ended Mar 2026 is 879.87% vs -36.52% in Mar 2025",
        "dir": 1
      }
    ],
    "table": {
      "header": [
        "Mar'26",
        "Mar'25",
        "Change(%)"
      ],
      "body": [
        {
          "field": "Net Sales",
          "val1": "412.93",
          "val2": "447.76",
          "chgp": "-7.78%",
          "chgp_class": "negative"
        },
        {
          "field": "Operating Profit (PBDIT) excl Other Income",
          "val1": "6.35",
          "val2": "23.63",
          "chgp": "-73.13%",
          "chgp_class": "negative"
        },
        {
          "field": "Interest",
          "val1": "13.76",
          "val2": "10.83",
          "chgp": "27.05%",
          "chgp_class": "negative"
        },
        {
          "field": "Exceptional Items",
          "val1": "0.00",
          "val2": "0.00",
          "chgp": "",
          "chgp_class": "neutral"
        },
        {
          "field": "Standalone Net Profit",
          "val1": "44.29",
          "val2": "4.52",
          "chgp": "879.87%",
          "chgp_class": "positive"
        },
        {
          "field": "Operating Profit Margin (Excl OI)",
          "val1": "1.54%",
          "val2": "5.28%",
          "chgp": "-3.74%",
          "chgp_class": "negative"
        }
      ]
    }
  }
]

Quarterly Results Snapshot (Standalone) - Jun'26 - YoYstock-summary

Jun'26
Jun'25
Change(%)
Net Sales
81.22
73.66
10.26%
Operating Profit (PBDIT) excl Other Income
3.47
-1.06
427.36%
Interest
2.25
3.22
-30.12%
Exceptional Items
-0.23
0.00
Standalone Net Profit
0.22
-0.69
131.88%
Operating Profit Margin (Excl OI)
4.27%
-1.44%
5.71%
Values in Rs Cr.
Direction Arrows
Net Sales

YoY Growth in quarter ended Jun 2026 is 10.26% vs -23.31% in Jun 2025

Direction Arrows
Standalone Net Profit

YoY Growth in quarter ended Jun 2026 is 131.88% vs -216.95% in Jun 2025

Half Yearly Results Snapshot (Consolidated) - Sep'25stock-summary

Sep'25
Sep'24
Change(%)
Net Sales
147.71
176.45
-16.29%
Operating Profit (PBDIT) excl Other Income
-3.39
11.87
-128.56%
Interest
6.71
6.40
4.84%
Exceptional Items
0.00
0.00
Consolidate Net Profit
-8.54
1.49
-673.15%
Operating Profit Margin (Excl OI)
-2.30%
6.73%
-9.03%
Values in Rs Cr.
Direction Arrows
Net Sales

Growth in half year ended Sep 2025 is -16.29% vs -11.89% in Sep 2024

Direction Arrows
Consolidated Net Profit

Growth in half year ended Sep 2025 is -673.15% vs -28.02% in Sep 2024

Nine Monthly Results Snapshot (Standalone) - Dec'25stock-summary

Dec'25
Dec'24
Change(%)
Net Sales
234.00
289.73
-19.24%
Operating Profit (PBDIT) excl Other Income
3.04
15.31
-80.14%
Interest
10.38
7.56
37.30%
Exceptional Items
0.00
0.00
Standalone Net Profit
-7.14
2.12
-436.79%
Operating Profit Margin (Excl OI)
1.30%
5.28%
-3.98%
Values in Rs Cr.
Direction Arrows
Net Sales

YoY Growth in nine months ended Dec 2025 is -19.24% vs -8.09% in Dec 2024

Direction Arrows
Standalone Net Profit

YoY Growth in nine months ended Dec 2025 is -436.79% vs -34.57% in Dec 2024

Annual Results Snapshot (Standalone) - Mar'26stock-summary

Mar'26
Mar'25
Change(%)
Net Sales
412.93
447.76
-7.78%
Operating Profit (PBDIT) excl Other Income
6.35
23.63
-73.13%
Interest
13.76
10.83
27.05%
Exceptional Items
0.00
0.00
Standalone Net Profit
44.29
4.52
879.87%
Operating Profit Margin (Excl OI)
1.54%
5.28%
-3.74%
Values in Rs Cr.
Direction Arrows
Net Sales

YoY Growth in year ended Mar 2026 is -7.78% vs 2.48% in Mar 2025

Direction Arrows
Standalone Net Profit

YoY Growth in year ended Mar 2026 is 879.87% vs -36.52% in Mar 2025

stock-summaryCompany CV
About Milkfood Ltd stock-summary
stock-summary
Milkfood Ltd
Micro Cap
FMCG
Milkfood Limited is a Punjab-based company, controlled by the Jaiswal family through L P Investments, a subsidiary of Jagatjit Industries, was incorporated in March, 1973. Its main products are milk powder, ghee, baby food, ice-creams and yoghurt. Presently, Company engages in manufacture and sale of dairy products like Ghee and Skimmed Milk Powder. It operate 2 manufacturing locations, one in the State of Punjab at Patiala and one in the State of Uttar Pradesh at Moradabad.
Company Coordinates stock-summary
Company Details
Bahadurgarh , Patiala Punjab : 147021
stock-summary
Tel: 91-0175-2381404
stock-summary
milkfoodltd@milkfoodltd.com
Registrar Details
Alankit Assignments Ltd , Alankit House , 2 E/21, Jhandewala Extension, New Delhi