United Nilgiri

  • Market Cap: Micro Cap
  • Industry: FMCG
  • ISIN: INE458F01011
  • NSEID: UNITEDTEA
  • BSEID:
INR
452.70
2.2 (0.49%)
BSENSE

Aug 25, 03:05 PM

BSE+NSE Vol: 372

  • Price Points
  • Score
  • Mojo Parameters
  • Total Return
  • News and Corporate Actions
  • Key factors
  • Shareholding
  • Financials
  • CompanyCV
stock-summaryPrice Point
High/Low

1Day

52 Week

Valuation
Technical
Day's Volume

CASH

372.0 (-91.08%) Volume

Shareholding (Jun 2026)

FII

0.00%

Held by 0 FIIs

DII

3.57%

Held by 2 DIIs

Promoter

49.86%

Why is United Nilgiri Tea Estates Company Ltd falling/rising?

25-Aug-2026

As of 24-Aug, the stock price of United Nilgiri Tea Estates Company Ltd is at 450.50, reflecting a decline of 0.76%. The stock has underperformed against the Sensex over various periods and is trading below its moving averages, indicating a bearish trend.

As of 24-Aug, the stock price of United Nilgiri Tea Estates Company Ltd is falling, currently at 450.50, which reflects a decrease of 3.45 (-0.76%). This decline is evident in the stock's performance over various periods, where it has underperformed against the benchmark Sensex. Over the past week, the stock has decreased by 1.13%, while the Sensex has only fallen by 0.28%. In the last month, the stock has dropped by 4.11%, contrasting with a 1.90% increase in the Sensex.<BR><BR>Additionally, the stock is trading below its moving averages across multiple time frames, including the 5-day, 20-day, 50-day, 100-day, and 200-day averages, indicating a bearish trend. Despite a rise in investor participation, with a delivery volume increase of 12.56% on August 21 compared to the 5-day average, the overall performance today shows that the stock has underperformed its sector by 1.91%. These factors collectively contribute to the downward movement of the stock price.

View full answer

Who are in the management team of United Nilgiri?

14-Aug-2026

The management team of United Nilgiri includes Mallika Srinivasan (Chairman), T G B Pinto (Whole-time Director), and several independent directors: Sankar Datta, Krishna Srinivasan, K V Sriram, Pillapakam Bahukudumbi Sampath, and R Vijayaraghavan, along with Company Secretary R V Sridharan and Director Parakkat Shobhana Ravi. This team offers a diverse range of expertise to the company.

The management team of United Nilgiri includes the following individuals:<BR><BR>1. **Mallika Srinivasan** - Chairman (Non-Executive)<BR>2. **T G B Pinto** - Whole-time Director<BR>3. **Sankar Datta** - Independent Director<BR>4. **Krishna Srinivasan** - Independent Director<BR>5. **K V Sriram** - Independent Director<BR>6. **R V Sridharan** - Company Secretary & Compliance Officer<BR>7. **Pillapakam Bahukudumbi Sampath** - Independent Director<BR>8. **R Vijayaraghavan** - Independent Director<BR>9. **Parakkat Shobhana Ravi** - Director<BR><BR>This team brings a diverse range of experience and expertise to the company. If you have any more questions about United Nilgiri or its operations, feel free to ask!

View full answer

What does United Nilgiri do?

14-Aug-2026

United Nilgiri Tea Estates Company Ltd is a micro-cap company engaged in tea cultivation and manufacturing, with recent net sales of 20 Cr and a net profit of 6 Cr for June 2026. It has a market cap of INR 230 Cr and key metrics include a P/E ratio of 11.00 and a dividend yield of 0.69%.

Overview: <BR>United Nilgiri Tea Estates Company Ltd is primarily engaged in the growing and manufacture of tea, operating within the FMCG industry and classified as a micro-cap company.<BR><BR>History: <BR>The company was incorporated in August 1922 and is part of the Chamraj group, which has a history of seventy-four years. The latest financial results reported are for the quarter ending June 2026, showing net sales and profit figures.<BR><BR>Financial Snapshot: <BR>Most recent Net Sales: 20 Cr (Quarterly Results - Jun 2026) <BR>Most recent Net Profit: 6 Cr (Quarterly Results - Jun 2026) <BR>Market-cap value: INR 230 Cr (Micro Cap)<BR><BR>Key Metrics: <BR>P/E: 11.00 <BR>Industry P/E: 53 <BR>Dividend Yield: 0.69% <BR>Debt-Equity: -0.16 <BR>Return on Equity: 8.41% <BR>Price to Book: 0.96<BR><BR>Contact Details: <BR>Address: No 3 Savithri Shanmugam Road, Race Course Coimbatore Tamil Nadu : 641018 <BR>Tel: 91-0422-2220566 <BR>Email: headoffice@unitednilgiritea.com <BR>Website: http://www.unitednilgiritea.com

View full answer

Who are the peers of the United Nilgiri?

14-Aug-2026

Peers of United Nilgiri include Jay Shree Tea, Integra Essentia, Indo National, Rossell India, Srivari Spices, SC Agrotech, NTC Industries, and Aveer Foods. Management risk varies from excellent at Srivari Spices to below average at Jay Shree Tea, with United Nilgiri showing average risk; Srivari Spices has the highest 1-year return at 42.81%, while United Nilgiri's return is -5.45%.

Peers: The peers of United Nilgiri are Jay Shree Tea, Integra Essentia, Indo National, Rossell India, The Peria Karama, Srivari Spices &, SC Agrotech, NTC Industries, and Aveer Foods.<BR><BR>Quality Snapshot: Excellent management risk is observed at Srivari Spices & and SC Agrotech, while Average management risk is found at United Nilgiri, Rossell India, Integra Essentia, The Peria Karama, and NTC Industries, and the rest. Below Average management risk is present at Jay Shree Tea, Indo National, and Aveer Foods. Growth ratings show Excellent growth at Srivari Spices & and Good growth at Aveer Foods, while Average growth is noted at NTC Industries and Below Average growth is found at United Nilgiri, Jay Shree Tea, Integra Essentia, Indo National, Rossell India, The Peria Karama, and the rest. Capital Structure ratings are Excellent for United Nilgiri, Good for Srivari Spices & and Aveer Foods, Average for Rossell India, and Below Average for Jay Shree Tea, Integra Essentia, Indo National, The Peria Karama, NTC Industries, and the rest.<BR><BR>Return Snapshot: The peer with the highest 1-year return is Srivari Spices & at 42.81%, while Indo National has the lowest at -32.60%. United Nilgiri's own 1-year return is -5.45%, which is better than Indo National but worse than Srivari Spices &. Additionally, the six-month returns are negative for Indo National, The Peria Karama, and Aveer Foods.

View full answer

How big is United Nilgiri?

14-Aug-2026

As of 14th August, United Nilgiri Tea Estates Company Ltd has a market capitalization of 231.00 Cr and reported net sales of 81.03 Cr and net profit of 20.30 Cr over the latest four quarters.

As of 14th August, <BR><BR>Market Cap: United Nilgiri Tea Estates Company Ltd has a market capitalization of 231.00 Cr, classified as a Micro Cap.<BR><BR>Recent Quarterly Performance: The sum of Net Sales for the latest 4 quarters is 81.03 Cr, while the sum of Net Profit for the same period is 20.30 Cr.<BR><BR>Balance Sheet Snapshot: The latest annual period is March 2018, with Shareholder's Funds reported at 116.19 Cr and Total Assets at 124.61 Cr.

View full answer

Should I buy, sell or hold United Nilgiri Tea Estates Company Ltd?

07-Aug-2026

Are United Nilgiri Tea Estates Company Ltd latest results good or bad?

21-May-2026

The latest results for United Nilgiri Tea Estates Company Ltd are unfavorable, showing a 31.20% decline in net profit and a 31.36% drop in net sales compared to the previous quarter. While the company maintains a healthy PAT margin of 22.44%, its heavy reliance on non-operating income raises concerns about the sustainability of its core earnings.

The latest results for United Nilgiri Tea Estates Company Ltd indicate a challenging quarter. For Q4 FY26, the company reported a net profit of ₹3.66 crore, which is a significant decline of 31.20% compared to the previous quarter and a 4.44% decrease year-on-year. Net sales also fell sharply to ₹16.31 crore, down 31.36% from the previous quarter and 13.79% from the same quarter last year.<BR><BR>Despite these declines in profit and sales, the company maintained a healthy PAT margin of 22.44%, which shows some resilience in profitability. However, a concerning aspect is the heavy reliance on non-operating income, which accounted for over 41% of profit before tax, raising questions about the sustainability of its core operational earnings.<BR><BR>Overall, while the company has managed to maintain some level of profitability, the significant drops in both net profit and sales suggest that the latest results are not favorable and highlight the volatility inherent in the tea plantation business. Investors may need to monitor upcoming quarters closely for signs of recovery, particularly in the typically stronger June quarter.

View full answer

How has been the historical performance of United Nilgiri?

03-Dec-2025

For the year ending March 2018, United Nilgiri reported net sales and total operating income of 57.58 crore, with a profit after tax of 12.15 crore and an EPS of 23.6. Total assets increased to 124.61 crore, while cash flow from operating activities decreased to 6.32 crore, resulting in a net cash outflow of 1.53 crore.

Answer:<BR>The historical performance of United Nilgiri for the year ending March 2018 shows a solid financial standing with notable metrics.<BR><BR>Breakdown:<BR>In March 2018, United Nilgiri reported net sales of 57.58 crore and total operating income of 57.58 crore, with total expenditure (excluding depreciation) amounting to 48.87 crore. This resulted in an operating profit (PBDIT) of 18.02 crore, leading to a profit before tax of 15.30 crore and a profit after tax of 12.15 crore. The consolidated net profit stood at 11.79 crore, with an earnings per share (EPS) of 23.6. The operating profit margin (excluding other income) was 15.14%, while the profit after tax margin was 21.1%. On the balance sheet, total assets increased to 124.61 crore from 108.49 crore the previous year, with shareholder's funds rising to 116.19 crore. The company maintained no long-term borrowings, and the book value per share adjusted to 232.53. Cash flow from operating activities decreased to 6.32 crore, contributing to a net cash outflow of 1.53 crore by the end of the period.

View full answer

Is United Nilgiri overvalued or undervalued?

14-Nov-2025

As of November 13, 2025, United Nilgiri is fairly valued with a PE ratio of 10.05 and has underperformed the Sensex with a year-to-date return of -21.41%.

As of 13 November 2025, the valuation grade for United Nilgiri has moved from attractive to fair. The company is currently fairly valued based on its financial ratios, which include a PE ratio of 10.05, a Price to Book Value of 0.92, and an EV to EBITDA of 10.11. Compared to its peers, United Nilgiri's valuation stands out, especially when contrasted with Tata Consumer, which is very expensive at a PE of 85.82, and CCL Products, which is very attractive at a PE of 41.24.<BR><BR>While United Nilgiri's valuation appears reasonable, it has underperformed relative to the Sensex in recent periods, with a year-to-date return of -21.41% compared to the Sensex's 9.45%. Overall, the company's financial metrics suggest it is fairly valued within the FMCG industry, but the recent stock performance indicates potential challenges ahead.

View full answer

Who are the top shareholders of the United Nilgiri?

17-Jul-2025

The top shareholders of United Nilgiri include Tractors And Farm Equipment Limited at 17.12%, Mr. A. Krishnamoorthy with 5.3%, and individual investors who collectively own 35.53%. There are no holdings by mutual funds or foreign institutional investors.

The top shareholders of United Nilgiri include the promoters, with Tractors And Farm Equipment Limited being the largest shareholder at 17.12%. Additionally, Mr. A. Krishnamoorthy, as the Trustee of T Stanes & Co Limited Staff Pension Fund, holds 5.3%, making him the highest public shareholder. Individual investors collectively own 35.53% of the company. There are currently no holdings by mutual funds or foreign institutional investors.

View full answer

What is the technical trend for United Nilgiri?

09-Jun-2025

As of June 2, 2025, United Nilgiri's technical trend is mildly bearish, driven by daily moving averages and monthly MACD, despite some bullish signals from Bollinger Bands and mixed indicators from KST and Dow Theory.

As of 2 June 2025, the technical trend for United Nilgiri has changed from mildly bullish to mildly bearish. The weekly MACD remains mildly bullish, but the monthly MACD indicates a mildly bearish stance. The daily moving averages are also showing a mildly bearish trend. The Bollinger Bands are bullish on both weekly and monthly time frames, suggesting some upward potential. However, the KST indicates a mixed outlook with weekly mildly bullish and monthly mildly bearish signals. The Dow Theory shows no trend on the weekly and mildly bullish on the monthly. Overall, the current technical stance is mildly bearish, influenced primarily by the daily moving averages and the monthly MACD.

View full answer

When is the next results date for United Nilgiri?

06-Jun-2025

No Upcoming Board Meetings

Has United Nilgiri declared dividend?

06-Jun-2025

Yes, United Nilgiri Tea Estates Company Ltd has declared a 10% dividend (₹1 per share) with an ex-date of February 21, 2025. The company has shown positive total returns over various periods, with a 5-year total return of 101.39%.

Yes, United Nilgiri Tea Estates Company Ltd has declared a dividend.<BR><BR>Dividend Details:<BR>- Percentage announced: 10%<BR>- Amount per share: 1<BR>- Ex-date: 21 Feb 25<BR><BR>Dividend Yield: 0.64%<BR><BR>Total Returns by Period:<BR>In the last 6 months, the price return was -8.83%, the dividend return was 0.20%, resulting in a total return of -8.63%.<BR><BR>Over the past year, the price return was 29.51%, the dividend return was 0.78%, leading to a total return of 30.29%.<BR><BR>In the 2-year period, the price return was 70.1%, the dividend return was 1.93%, which culminated in a total return of 72.03%.<BR><BR>For the 3-year period, the price return was 30.02%, the dividend return was 2.25%, resulting in a total return of 32.27%.<BR><BR>In the last 4 years, the price return was 29.29%, the dividend return was 3.01%, leading to a total return of 32.3%.<BR><BR>Finally, over the 5-year period, the price return was 96.26%, the dividend return was 5.13%, resulting in a total return of 101.39%.<BR><BR>Overall, the company has declared a dividend and has shown positive total returns over various periods, indicating a favorable performance for investors.

View full answer
iScoreScore
Click here to find our call on this stock
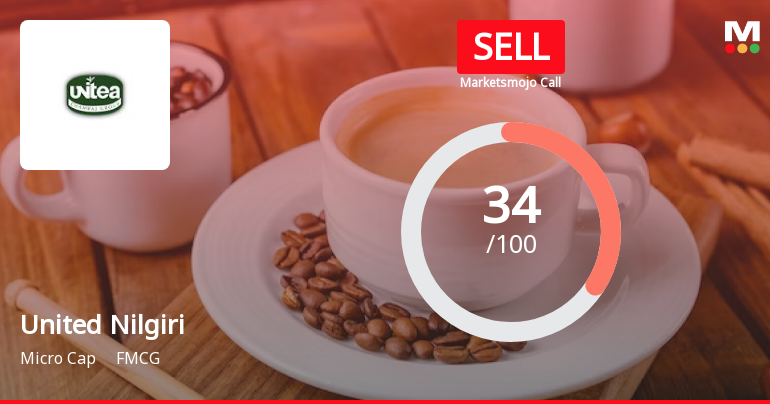
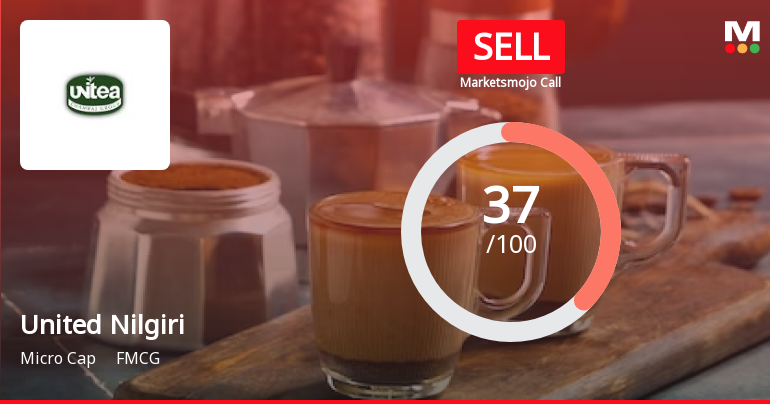
Strong Sell
Sell
Hold
Buy
Strong Buy

Dashboard

1

Poor long term growth as Net Sales has grown by an annual rate of 2.50% and Operating profit at 15.54% over the last 5 years

 
2

Flat results in Jun 26

3

Below par performance in long term as well as near term

stock-summaryMojo Parameters

Mojo Parameters

Loading Valuation Snapshot...

Stock DNA

stock-summary
Industry

FMCG

stock-summary
Market cap

INR 225 Cr (Micro Cap)

stock-summary
P/E

11.00

stock-summary
Industry P/E

52

stock-summary
Dividend Yield

0.71%

stock-summary
Debt Equity

-0.16

stock-summary
Return on Equity

8.41%

stock-summary
Price to Book

0.93

Revenue and Profits:
Net Sales:
20 Cr
(Quarterly Results - Jun 2026)
Net Profit:
6 Cr
stock-summaryTotal Returns
Total Returns (Price + Dividend) stock-summary
Dividend Yield (0.71%)
TimePeriod
Price Return
Dividend Return
Total Return
3 Months
-12.33%
0.43%
-11.9%
6 Months
-11.35%
0.43%
-10.92%
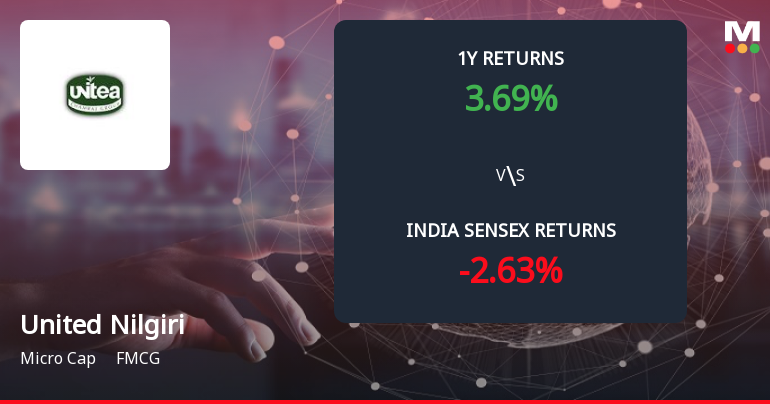
1 Year
-6.07%
0.67%
-5.4%
2 Years
6.38%
1.48%
7.86%
3 Years
49.8%
2.78%
52.58%
4 Years
46.43%
3.81%
50.24%
5 Years
11.49%
3.37%
14.86%

Latest dividend: 2.2 per share ex-dividend date: Jul-31-2026

Risk Adjusted Returns v/s stock-summary
Returns Beta
Icon
Beta has not been calculated since enough price history is not available
stock-summaryNews & Corporate Actions

Announcements stock-summary

Financial Results Updates

07-Aug-2019 | Source : NSE

The United Nilgiri Tea Estates Company Limited has submitted to the Exchange a copy of Financial results for the period ended June 30, 2019 in Machine Readable and searchable Form.

Shareholders meeting

22-Jul-2019 | Source : NSE

The United Nilgiri Tea Estates Company Limited has submitted the Exchange a copy Srutinizers report of Annual General Meeting held on July 20, 2019. Further, the company has informed the Exchange regarding voting results.

Financial Result Updates

20-Jul-2019 | Source : NSE

The United Nilgiri Tea Estates Company Limited has submitted to the Exchange, the financial results for the period ended June 30, 2019.

Corporate Actions stock-summary

stock-summary
BOARD MEETING

No Upcoming Board Meetings

stock-summary
DIVIDEND

United Nilgiri Tea Estates Company Ltd has declared 22% dividend, ex-date: 31 Jul 26

stock-summary
SPLITS

No Splits history available

stock-summary
BONUS

No Bonus history available

stock-summary
RIGHTS

No Rights history available

stock-summaryKey Factors

Quality key factors stock-summary

Factor
Value
Sales Growth (5y)
2.50%
EBIT Growth (5y)
15.54%
EBIT to Interest (avg)
11.91
Debt to EBITDA (avg)
0.18
Net Debt to Equity (avg)
-0.16
Sales to Capital Employed (avg)
0.41
Tax Ratio
17.06%
Dividend Payout Ratio
8.10%
Pledged Shares
0
Institutional Holding
3.58%
ROCE (avg)
6.37%
ROE (avg)
7.54%

Valuation key factors

Factor
Value
P/E Ratio
11
Industry P/E
Price to Book Value
0.93
EV to EBIT
12.69
EV to EBITDA
10.26
EV to Capital Employed
0.92
EV to Sales
2.31
PEG Ratio
NA
Dividend Yield
0.71%
ROCE (Latest)
8.05%
ROE (Latest)
8.41%

Technicals key factors

Indicator
Weekly
Monthly
MACD
Bearish
Mildly Bearish
RSI
No Signal
No Signal
Bollinger Bands
Bearish
Bearish
Moving Averages
Bearish (Daily)
KST
Bearish
Mildly Bearish
Dow Theory
No Trend
Mildly Bearish
OBV
No Trend
Mildly Bearish
stock-summary Technical Indicator Scale: Bearish, Mildly Bearish, Sideways, Mildly Bullish, Bullish  Turned 
stock-summaryShareholding
Shareholding Snapshot : Jun 2026stock-summary
Shareholding Compare (%holding) stock-summary
Majority shareholders

Promoters

Pledged Promoter Holdings

None

Mutual Funds

Held by 0 Schemes

FIIs

Held by 0 FIIs

Promoter with highest holding

Tractors And Farm Equipment Limited (17.12%)

Highest Public shareholder

Mr. A.krishnamoorthy Trustee Of T Stanes & Co Limited Staff Pension Fund (5.3%)

Individual Investors Holdings

33.16%

stock-summaryFinancial
[
  {
    "link": "quarterly",
    "btn_text": "All Quarterly Results",
    "header": "Quarterly Results Snapshot (Standalone) - Jun'26 - QoQ",
    "rhs": [
      {
        "prefix": "Net Sales ",
        "suffix": "QoQ Growth in quarter ended Jun 2026 is 21.58% vs -31.36% in Mar 2026",
        "dir": 1
      },
      {
        "prefix": "Standalone Net Profit ",
        "suffix": "QoQ Growth in quarter ended Jun 2026 is 74.32% vs -31.20% in Mar 2026",
        "dir": 1
      }
    ],
    "table": {
      "header": [
        "Jun'26",
        "Mar'26",
        "Change(%)"
      ],
      "body": [
        {
          "field": "Net Sales",
          "val1": "19.83",
          "val2": "16.31",
          "chgp": "21.58%",
          "chgp_class": "positive"
        },
        {
          "field": "Operating Profit (PBDIT) excl Other Income",
          "val1": "5.08",
          "val2": "3.41",
          "chgp": "48.97%",
          "chgp_class": "positive"
        },
        {
          "field": "Interest",
          "val1": "0.03",
          "val2": "0.03",
          "chgp": "",
          "chgp_class": "neutral"
        },
        {
          "field": "Exceptional Items",
          "val1": "0.00",
          "val2": "0.00",
          "chgp": "",
          "chgp_class": "neutral"
        },
        {
          "field": "Standalone Net Profit",
          "val1": "6.38",
          "val2": "3.66",
          "chgp": "74.32%",
          "chgp_class": "positive"
        },
        {
          "field": "Operating Profit Margin (Excl OI)",
          "val1": "25.62%",
          "val2": "20.91%",
          "chgp": "4.71%",
          "chgp_class": "positive"
        }
      ]
    }
  },
  {
    "link": "half-yearly",
    "btn_text": "All Half Yearly Results",
    "header": "Half Yearly Results Snapshot (Standalone) - Sep'25",
    "rhs": [
      {
        "prefix": "Net Sales ",
        "suffix": " Growth in half year ended Sep 2025 is -9.72% vs 24.45% in Sep 2024",
        "dir": -1
      },
      {
        "prefix": "Standalone Net Profit ",
        "suffix": " Growth in half year ended Sep 2025 is 27.56% vs 16.51% in Sep 2024",
        "dir": 1
      }
    ],
    "table": {
      "header": [
        "Sep'25",
        "Sep'24",
        "Change(%)"
      ],
      "body": [
        {
          "field": "Net Sales",
          "val1": "43.28",
          "val2": "47.94",
          "chgp": "-9.72%",
          "chgp_class": "negative"
        },
        {
          "field": "Operating Profit (PBDIT) excl Other Income",
          "val1": "11.18",
          "val2": "8.37",
          "chgp": "33.57%",
          "chgp_class": "positive"
        },
        {
          "field": "Interest",
          "val1": "0.06",
          "val2": "0.04",
          "chgp": "50.00%",
          "chgp_class": "negative"
        },
        {
          "field": "Exceptional Items",
          "val1": "0.00",
          "val2": "0.00",
          "chgp": "",
          "chgp_class": "neutral"
        },
        {
          "field": "Standalone Net Profit",
          "val1": "12.96",
          "val2": "10.16",
          "chgp": "27.56%",
          "chgp_class": "positive"
        },
        {
          "field": "Operating Profit Margin (Excl OI)",
          "val1": "25.83%",
          "val2": "17.46%",
          "chgp": "8.37%",
          "chgp_class": "positive"
        }
      ]
    }
  },
  {
    "link": "nine-monthly",
    "btn_text": "All Nine Monthly Results",
    "header": "Nine Monthly Results Snapshot (Standalone) - Dec'25",
    "rhs": [
      {
        "prefix": "Net Sales ",
        "suffix": "YoY Growth in nine months ended Dec 2025 is -5.42% vs 14.10% in Dec 2024",
        "dir": -1
      },
      {
        "prefix": "Standalone Net Profit ",
        "suffix": "YoY Growth in nine months ended Dec 2025 is 24.52% vs 12.92% in Dec 2024",
        "dir": 1
      }
    ],
    "table": {
      "header": [
        "Dec'25",
        "Dec'24",
        "Change(%)"
      ],
      "body": [
        {
          "field": "Net Sales",
          "val1": "67.04",
          "val2": "70.88",
          "chgp": "-5.42%",
          "chgp_class": "negative"
        },
        {
          "field": "Operating Profit (PBDIT) excl Other Income",
          "val1": "16.40",
          "val2": "12.74",
          "chgp": "28.73%",
          "chgp_class": "positive"
        },
        {
          "field": "Interest",
          "val1": "0.09",
          "val2": "0.07",
          "chgp": "28.57%",
          "chgp_class": "negative"
        },
        {
          "field": "Exceptional Items",
          "val1": "0.00",
          "val2": "0.00",
          "chgp": "",
          "chgp_class": "neutral"
        },
        {
          "field": "Standalone Net Profit",
          "val1": "18.28",
          "val2": "14.68",
          "chgp": "24.52%",
          "chgp_class": "positive"
        },
        {
          "field": "Operating Profit Margin (Excl OI)",
          "val1": "24.46%",
          "val2": "17.97%",
          "chgp": "6.49%",
          "chgp_class": "positive"
        }
      ]
    }
  },
  {
    "link": "annual",
    "btn_text": "All Annual Results",
    "header": "Annual Results Snapshot (Standalone) - Mar'26",
    "rhs": [
      {
        "prefix": "Net Sales ",
        "suffix": "YoY Growth in year ended Mar 2026 is -7.18% vs 6.88% in Mar 2025",
        "dir": -1
      },
      {
        "prefix": "Standalone Net Profit ",
        "suffix": "YoY Growth in year ended Mar 2026 is 18.53% vs 15.33% in Mar 2025",
        "dir": 1
      }
    ],
    "table": {
      "header": [
        "Mar'26",
        "Mar'25",
        "Change(%)"
      ],
      "body": [
        {
          "field": "Net Sales",
          "val1": "83.35",
          "val2": "89.80",
          "chgp": "-7.18%",
          "chgp_class": "negative"
        },
        {
          "field": "Operating Profit (PBDIT) excl Other Income",
          "val1": "19.82",
          "val2": "15.37",
          "chgp": "28.95%",
          "chgp_class": "positive"
        },
        {
          "field": "Interest",
          "val1": "0.12",
          "val2": "0.10",
          "chgp": "20.00%",
          "chgp_class": "negative"
        },
        {
          "field": "Exceptional Items",
          "val1": "0.00",
          "val2": "0.00",
          "chgp": "",
          "chgp_class": "neutral"
        },
        {
          "field": "Standalone Net Profit",
          "val1": "21.94",
          "val2": "18.51",
          "chgp": "18.53%",
          "chgp_class": "positive"
        },
        {
          "field": "Operating Profit Margin (Excl OI)",
          "val1": "23.78%",
          "val2": "17.12%",
          "chgp": "6.66%",
          "chgp_class": "positive"
        }
      ]
    }
  }
]

Quarterly Results Snapshot (Standalone) - Jun'26 - QoQstock-summary

Jun'26
Mar'26
Change(%)
Net Sales
19.83
16.31
21.58%
Operating Profit (PBDIT) excl Other Income
5.08
3.41
48.97%
Interest
0.03
0.03
Exceptional Items
0.00
0.00
Standalone Net Profit
6.38
3.66
74.32%
Operating Profit Margin (Excl OI)
25.62%
20.91%
4.71%
Values in Rs Cr.
Direction Arrows
Net Sales

QoQ Growth in quarter ended Jun 2026 is 21.58% vs -31.36% in Mar 2026

Direction Arrows
Standalone Net Profit

QoQ Growth in quarter ended Jun 2026 is 74.32% vs -31.20% in Mar 2026

Half Yearly Results Snapshot (Standalone) - Sep'25stock-summary

Sep'25
Sep'24
Change(%)
Net Sales
43.28
47.94
-9.72%
Operating Profit (PBDIT) excl Other Income
11.18
8.37
33.57%
Interest
0.06
0.04
50.00%
Exceptional Items
0.00
0.00
Standalone Net Profit
12.96
10.16
27.56%
Operating Profit Margin (Excl OI)
25.83%
17.46%
8.37%
Values in Rs Cr.
Direction Arrows
Net Sales

Growth in half year ended Sep 2025 is -9.72% vs 24.45% in Sep 2024

Direction Arrows
Standalone Net Profit

Growth in half year ended Sep 2025 is 27.56% vs 16.51% in Sep 2024

Nine Monthly Results Snapshot (Standalone) - Dec'25stock-summary

Dec'25
Dec'24
Change(%)
Net Sales
67.04
70.88
-5.42%
Operating Profit (PBDIT) excl Other Income
16.40
12.74
28.73%
Interest
0.09
0.07
28.57%
Exceptional Items
0.00
0.00
Standalone Net Profit
18.28
14.68
24.52%
Operating Profit Margin (Excl OI)
24.46%
17.97%
6.49%
Values in Rs Cr.
Direction Arrows
Net Sales

YoY Growth in nine months ended Dec 2025 is -5.42% vs 14.10% in Dec 2024

Direction Arrows
Standalone Net Profit

YoY Growth in nine months ended Dec 2025 is 24.52% vs 12.92% in Dec 2024

Annual Results Snapshot (Standalone) - Mar'26stock-summary

Mar'26
Mar'25
Change(%)
Net Sales
83.35
89.80
-7.18%
Operating Profit (PBDIT) excl Other Income
19.82
15.37
28.95%
Interest
0.12
0.10
20.00%
Exceptional Items
0.00
0.00
Standalone Net Profit
21.94
18.51
18.53%
Operating Profit Margin (Excl OI)
23.78%
17.12%
6.66%
Values in Rs Cr.
Direction Arrows
Net Sales

YoY Growth in year ended Mar 2026 is -7.18% vs 6.88% in Mar 2025

Direction Arrows
Standalone Net Profit

YoY Growth in year ended Mar 2026 is 18.53% vs 15.33% in Mar 2025

stock-summaryCompany CV
About United Nilgiri Tea Estates Company Ltd stock-summary
stock-summary
United Nilgiri Tea Estates Company Ltd
Micro Cap
FMCG
The United Nilgiri Tea Estates Company Limited (UNITEA), a part of seventy four year old Chamraj group company was incorporated in August, 1922. The Company is primarily engaged in growing and manufacture of Tea besides Letting-out of property. The Company's teas are sold both in domestic and international markets. Apart from producing Green and Black Teas, the company also produce and markets Herbal Tea, Aroma Tea, Flavoured and Iced Tea.
Company Coordinates stock-summary
Company Details
No 3 Savithri Shanmugam Road, Race Course Coimbatore Tamil Nadu : 641018
stock-summary
Tel: 91-0422-2220566
stock-summary
headoffice@unitednilgiritea.com
Registrar Details
Integrated Enterprises (India) Ltd , II Floor , Kences Towers, No 1 Ramakrishna Street, North Usman Road, T Nagar, Chennai