Mishra Dhatu Nig

  • Market Cap: Small Cap
  • Industry: Aerospace & Defense
  • ISIN: INE099Z01011
  • NSEID: MIDHANI
  • BSEID: 541195
INR
447.80
-15.55 (-3.36%)
BSENSE

Sep 11, 03:30 PM

BSE+NSE Vol: 20.3 lacs

  • Price Points
  • Score
  • Mojo Parameters
  • Total Return
  • News and Corporate Actions
  • Key factors
  • Shareholding
  • Financials
  • CompanyCV
stock-summaryPrice Point
High/Low

1Day

52 Week

Valuation
Technical
Day's Volume

CASH

20.3 lacs (-79.89%) Volume

Shareholding (Jun 2026)

FII

2.56%

Held by 79 FIIs

DII

7.37%

Held by 10 DIIs

Promoter

74.00%

Why is Mishra Dhatu Nigam Ltd falling/rising?

06-Sep-2026

As of 05-Sep, Mishra Dhatu Nigam Ltd's stock price is rising, currently at 418.85, with a positive trend reflected in recent gains and strong financial performance, including significant increases in net sales and profit after tax. Institutional investor participation has also increased, indicating a favorable outlook despite a decline in delivery volume.

As of 05-Sep, Mishra Dhatu Nigam Ltd's stock price is rising, currently at 418.85, reflecting a change of 2.45 (0.59%) upward. The stock has shown a positive trend, gaining for the last two days with a total return of 1.39% during this period. Additionally, the stock's performance over the past week and month has been favorable, with returns of +0.20% and +1.70%, respectively, while the benchmark Sensex has declined by -0.97% and -2.44% in the same time frames.<BR><BR>The company's financial health is also a contributing factor to its rising stock price. It has demonstrated strong growth in net sales and profit after tax (PAT) over the latest six months, with net sales increasing by 36.34% to Rs 792.24 crore and PAT growing by 36.43% to Rs 94.37 crore. Furthermore, the company has a low Debt to EBITDA ratio of 1.71 times, indicating a strong ability to service its debt, which is appealing to investors.<BR><BR>Moreover, there is an increasing participation by institutional investors, who have raised their stake by 0.8% over the previous quarter, now holding 9.94% of the company. This suggests a positive outlook from more sophisticated investors who typically have better resources to analyze company fundamentals.<BR><BR>Despite a decline in delivery volume, which fell by -46.08% against the 5-day average, the stock remains liquid enough for trading, supporting its price stability. Overall, the combination of strong financial performance, institutional interest, and recent positive price movements contributes to the rising trend of Mishra Dhatu Nigam Ltd's stock price.

View full answer

Who are in the management team of Mishra Dhatu Nig?

01-Sep-2026

The management team of Mishra Dhatu Nig includes S K Jha (Chairman & Managing Director), Gowri Sankararao Naramsetti (Director, Finance & CFO), Paul Antony (Company Secretary), and several government nominees and independent directors overseeing the company's operations and strategy.

The management team of Mishra Dhatu Nig includes the following individuals:<BR><BR>1. **S K Jha** - Chairman & Managing Director<BR>2. **Gowri Sankararao Naramsetti** - Director (Finance) & CFO<BR>3. **Paul Antony** - Company Secretary & Compliance Officer<BR>4. **Anurag Bajpai** - Nominee (Government)<BR>5. **Surendra Prasad Yadav** - Nominee (Government)<BR>6. **V Chakrapani** - Independent Director<BR>7. **V. T. Rema** - Independent Director<BR>8. **Thulasiraman Muthukumar** - Director (Production)<BR><BR>This team is responsible for overseeing the operations and strategic direction of the company.

View full answer

What does Mishra Dhatu Nig do?

01-Sep-2026

Mishra Dhatu Nigam Ltd manufactures super alloys, titanium base alloys, and special metals for the aerospace and defense sectors. As of June 2026, it reported net sales of ₹239 Cr and a net profit of ₹16 Cr, with a market cap of ₹7,662 Cr.

Overview: <BR>Mishra Dhatu Nigam Ltd is engaged in the manufacturing of Super Alloys, Titanium base Alloys, Special Stainless Steel, and other special metals within the Aerospace & Defense industry, categorized as a Small Cap company.<BR><BR>History: <BR>Mishra Dhatu Nigam Ltd was incorporated in 1973. It is a Public Sector Undertaking and reported its latest quarterly results for June 2026, with net sales and profit figures available.<BR><BR>Financial Snapshot: <BR>Most recent Net Sales: 239 Cr (Quarterly Results - Jun 2026) <BR>Most recent Net Profit: 16 Cr (Quarterly Results - Jun 2026) <BR>Market-cap value: INR 7,662 Cr (Small Cap)<BR><BR>Key Metrics: <BR>P/E: 57.00 <BR>Industry P/E: 25 <BR>Dividend Yield: 0.19% <BR>Debt-Equity: 0.14 <BR>Return on Equity: 8.58% <BR>Price-to-Book: 5.13 <BR><BR>Contact Details: <BR>Address: P O Kanchanbagh, Hyderabad Telangana: 500058 <BR>Tel: 91-40-24184000 <BR>Email: secretary@midhani.com <BR>Website: http://www.midhani.com

View full answer

Who are the peers of the Mishra Dhatu Nig?

01-Sep-2026

Peers of Mishra Dhatu Nig include Astra Microwave, Apollo Micro Sys, Sigma Advanced S, and others. In terms of management risk, Apollo Micro Sys shows average risk, while Sigma Advanced S has below average risk; Mishra Dhatu Nig has a below average growth rating and a 1-year return of 14.73%.

Peers: The peers of Mishra Dhatu Nig are Astra Microwave, Apollo Micro Sys, Sigma Advanced S, Swan Defence, Paras Defence, Unimech Aero., Avantel, Rossell Techsys, Ideaforge Tech.<BR><BR>Quality Snapshot: Excellent management risk is observed at Astra Microwave, while Average management risk is found at Apollo Micro Sys, Paras Defence, Unimech Aero., Avantel, and Rossell Techsys, and the rest. Below Average management risk is noted for Sigma Advanced S, Swan Defence, Ideaforge Tech, and Jaykay Enter. Growth is Excellent for Apollo Micro Sys and Sigma Advanced S, Average for Paras Defence, Unimech Aero., and the rest, and Below Average for Mishra Dhatu Nig, Swan Defence, Avantel, and Ideaforge Tech. Capital Structure is Excellent for Paras Defence, Unimech Aero., and Avantel, Good for Mishra Dhatu Nig and Astra Microwave, and Below Average for Sigma Advanced S, Swan Defence, and Rossell Techsys.<BR><BR>Return Snapshot: The peer with the highest 1-year return is Sigma Advanced S at 482.02%, while the lowest is Swan Defence with N/A, and Mishra Dhatu Nig's 1-year return is 14.73%. Additionally, Swan Defence has a negative six-month return.

View full answer

How big is Mishra Dhatu Nig?

01-Sep-2026

As of 31st August, Mishra Dhatu Nigam Ltd has a market capitalization of 7,662.00 Cr, with recent Net Sales of 1,277.63 Cr and a Net Profit of 134.97 Cr.

As of 31st August, Mishra Dhatu Nigam Ltd has a market capitalization of 7,662.00 Cr, categorizing it as a Small Cap company.<BR><BR>In the latest four quarters, the company reported Net Sales of 1,277.63 Cr and a Net Profit of 134.97 Cr.<BR><BR>The latest annual period for the balance sheet is March 2025, with Shareholder's Funds amounting to 1,414.97 Cr and Total Assets of 2,914.65 Cr.

View full answer

Should I buy, sell or hold Mishra Dhatu Nigam Ltd?

14-Aug-2026

Are Mishra Dhatu Nigam Ltd latest results good or bad?

12-Aug-2026

Mishra Dhatu Nigam Ltd's latest results are strong, with significant increases in net sales and profit, indicating robust operational performance. However, the high price-to-earnings ratio and moderate return on equity suggest caution for new investors, while existing shareholders may consider holding their positions.

Mishra Dhatu Nigam Ltd (MIDHANI) has recently reported strong results for the March 2026 quarter, showcasing a significant turnaround in performance. The company achieved net sales of ₹552.75 crores, which is a remarkable 100.52% increase quarter-on-quarter and a 34.63% increase year-on-year. Additionally, the consolidated net profit surged to ₹77.90 crores, reflecting an impressive 181.84% growth from the previous quarter and a 38.61% increase compared to the same quarter last year.<BR><BR>The operating margin also expanded to 21.84%, indicating effective cost management alongside the substantial revenue growth. This performance highlights MIDHANI's ability to capitalize on its strong order book, particularly in the defence sector, where demand for its specialized metallurgical products remains robust.<BR><BR>However, despite these positive results, the company's valuation metrics raise some concerns. MIDHANI is trading at a high price-to-earnings ratio of 72 times, which suggests that the stock is considered expensive relative to its earnings. Additionally, while the recent performance is strong, the company's return on equity (ROE) is moderate at 11.05%, which may not justify such a premium valuation for new investors.<BR><BR>In summary, while MIDHANI's latest results are certainly good, reflecting strong operational momentum and profitability, the elevated valuation could be a point of caution for potential investors. Existing shareholders may consider holding their positions, but new investors might want to wait for a more favorable entry point.

View full answer

When is the next results date for Mishra Dhatu Nigam Ltd?

05-Aug-2026

Mishra Dhatu Nigam Ltd will announce its results on 12 August 2026.

Mishra Dhatu Nigam Ltd is scheduled to declare its results on 12 August 2026.

View full answer

Is Mishra Dhatu Nig technically bullish or bearish?

24-Nov-2025

As of November 21, 2025, Mishra Dhatu Nig's technical trend is mildly bearish, supported by bearish indicators across weekly and monthly charts, despite a mildly bullish signal from daily moving averages.

As of 21 November 2025, the technical trend for Mishra Dhatu Nig has changed from sideways to mildly bearish. The current technical stance is mildly bearish, driven by several indicators. The MACD is bearish on the weekly and mildly bearish on the monthly time frames, while Bollinger Bands and KST both indicate bearish conditions on both weekly and monthly charts. Dow Theory also supports a mildly bearish outlook for both weekly and monthly periods. Although the daily moving averages show a mildly bullish signal, the overall sentiment is tempered by the bearish indicators across longer time frames. The RSI shows no signals, indicating a lack of momentum in either direction. The stock has underperformed the Sensex over the past month and week, further supporting the bearish stance.

View full answer

How has been the historical performance of Mishra Dhatu Nig?

21-Nov-2025

Mishra Dhatu Nig has shown steady growth in net sales and total operating income, reaching 1,074.11 Cr in Mar'25, but has faced declines in operating profit, profit before tax, and profit after tax. While total assets increased, cash flow improved slightly, indicating a need for careful cash management.

Answer:<BR>The historical performance of Mishra Dhatu Nig shows a steady growth in net sales and total operating income over the years, with net sales reaching 1,074.11 Cr in Mar'25, slightly up from 1,072.68 Cr in Mar'24 and significantly higher than 871.95 Cr in Mar'23. The total operating income mirrored this trend, increasing to 1,074.11 Cr in Mar'25 from 1,072.68 Cr in Mar'24. However, the operating profit (PBDIT) has seen fluctuations, peaking at 295.29 Cr in Mar'23 before declining to 248.97 Cr in Mar'25. Profit before tax also experienced a decline from 216.55 Cr in Mar'23 to 156.04 Cr in Mar'25, while profit after tax decreased from 155.87 Cr in Mar'23 to 110.07 Cr in Mar'25. The earnings per share (EPS) followed a similar pattern, dropping to 5.92 in Mar'25 from 8.34 in Mar'23. On the balance sheet, total assets rose to 2,914.65 Cr in Mar'25, up from 2,905.43 Cr in Mar'24, with total liabilities also increasing slightly to 2,914.65 Cr. Cash flow from operating activities improved to 216.00 Cr in Mar'25 from 215.00 Cr in Mar'24, although the net cash outflow was recorded at -5.00 Cr in Mar'25.<BR><BR>Breakdown:<BR>Mishra Dhatu Nig has demonstrated consistent growth in net sales and total operating income, with figures reaching 1,074.11 Cr in Mar'25, reflecting a slight increase from the previous year. Despite this growth in revenue, the operating profit has fluctuated, peaking in Mar'23 and declining thereafter, indicating potential challenges in maintaining profit margins. Profit before tax and profit after tax have also seen declines, suggesting pressures on profitability. The company's total assets have increased, indicating a solid asset base, while total liabilities have remained stable. Cash flow from operating activities has shown improvement, although the overall cash position has slightly worsened, highlighting the need for careful cash management moving forward.

View full answer

Who are the top shareholders of the Mishra Dhatu Nig?

17-Jul-2025

The top shareholders of Mishra Dhatu Nig include The President of India with 74.0%, HDFC Trustee Company Ltd. with 4.48%, mutual funds with 7.06%, foreign institutional investors holding 1.65%, and individual investors owning 13.74%.

The top shareholders of Mishra Dhatu Nig include The President of India, who holds a significant 74.0% of the shares, making them the largest promoter. Additionally, HDFC Trustee Company Ltd., acting on behalf of the HDFC Balanced Advantage Fund, is the highest public shareholder with a stake of 4.48%. The company also has mutual funds holding shares through 10 different schemes, which collectively account for 7.06%, and foreign institutional investors (FIIs) hold 1.65% through 78 different entities. Individual investors collectively own 13.74% of the shares.

View full answer

Is Mishra Dhatu Nig overvalued or undervalued?

09-Jun-2025

As of March 29, 2023, Mishra Dhatu Nig is considered very expensive with a PE ratio of 71.88, significantly higher than industry peers, indicating overvaluation despite a recent 31.43% stock performance that outpaced the Sensex.

As of 29 March 2023, the valuation grade for Mishra Dhatu Nig has moved from expensive to very expensive, indicating a significant shift in its market perception. The company is currently overvalued, with a PE ratio of 71.88, a Price to Book Value of 5.63, and an EV to EBITDA of 37.91. These ratios suggest that the stock is trading at a premium compared to its earnings and book value, raising concerns about its sustainability at these levels.<BR><BR>In comparison to its peers in the Aerospace & Defense industry, Mishra Dhatu Nig's valuation stands out as notably high; for instance, its PE ratio of 71.88 is substantially above the industry average. Other comparable companies in the sector are likely to show more reasonable valuations, further emphasizing the overvaluation of Mishra Dhatu Nig. While the stock has outperformed the Sensex over the past month with a return of 31.43% compared to the Sensex's 3.84%, this performance does not mitigate the concerns surrounding its high valuation metrics.

View full answer

Has Mishra Dhatu Nig declared dividend?

06-Jun-2025

Yes, Mishra Dhatu Nigam Ltd has declared a 7% dividend, amounting to ₹0.7 per share, with an ex-date of March 25, 2025. The company has demonstrated positive total returns across various periods, reflecting its commitment to shareholder value.

Mishra Dhatu Nigam Ltd has declared a 7% dividend.<BR><BR>Dividend Details:<BR>- Percentage announced: 7%<BR>- Amount per share: 0.7<BR>- Ex-date: 25 Mar 25<BR><BR>Dividend Yield: 0.16%.<BR><BR>Total Returns by Period:<BR>In the last 6 months, the price return was 12.65%, the dividend return was 0.18%, resulting in a total return of 12.83%.<BR><BR>Over the past year, the price return was 4.67%, the dividend return was 0.16%, leading to a total return of 4.83%.<BR><BR>In the 2-year period, the price return reached 77.8%, with a dividend return of 1.30%, culminating in a total return of 79.1%.<BR><BR>For the 3-year period, the price return was 151.7%, the dividend return was 4.30%, which resulted in a total return of 156.0%.<BR><BR>In the last 4 years, the price return was 122.83%, the dividend return was 4.72%, giving a total return of 127.55%.<BR><BR>Finally, over the 5-year period, the price return was 112.24%, the dividend return was 5.84%, leading to a total return of 118.08%.<BR><BR>Overall, Mishra Dhatu Nigam Ltd has shown a consistent performance with positive total returns across all periods, alongside a declared dividend, indicating a commitment to returning value to shareholders.

View full answer
iScoreScore
Click here to find our call on this stock
Strong Sell
Sell
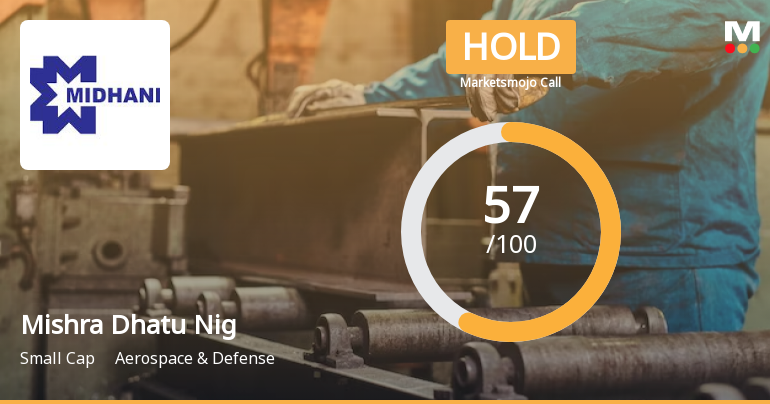
Hold
Buy
Strong Buy

Dashboard

1

Strong ability to service debt as the company has a low Debt to EBITDA ratio of 1.71 times

 
2

Poor long term growth as Operating profit has grown by an annual rate -6.15% of over the last 5 years

 
3

Positive results in Jun 26

4

With ROCE of 9.8, it has a Very Expensive valuation with a 4.9 Enterprise value to Capital Employed

5

Increasing Participation by Institutional Investors

6

Market Beating Performance

stock-summaryMojo Parameters

Mojo Parameters

Loading Valuation Snapshot...

Stock DNA

stock-summary
Industry

Aerospace & Defense

stock-summary
Market cap

INR 8,368 Cr (Small Cap)

stock-summary
P/E

62.00

stock-summary
Industry P/E

25

stock-summary
Dividend Yield

0.17%

stock-summary
Debt Equity

0.14

stock-summary
Return on Equity

8.58%

stock-summary
Price to Book

5.69

Revenue and Profits:
Net Sales:
239 Cr
(Quarterly Results - Jun 2026)
Net Profit:
16 Cr
stock-summaryTotal Returns
Total Returns (Price + Dividend) stock-summary
Dividend Yield (0.17%)
TimePeriod
Price Return
Dividend Return
Total Return
3 Months
5.95%
0.28%
6.23%
6 Months
33.25%
0.65%
33.9%
1 Year
15.2%
0.48%
15.68%
2 Years
13.7%
0.68%
14.38%
3 Years
3.36%
1.01%
4.37%
4 Years
119.94%
3.49%
123.43%
5 Years
143.57%
5.29%
148.86%

Latest dividend: 0.7999999999999999 per share ex-dividend date: Mar-18-2026

Risk Adjusted Returns v/s stock-summary
Returns Beta
Icon
Beta has not been calculated since enough price history is not available
stock-summaryNews & Corporate Actions

News

Mishra Dhatu Nigam Ltd Gains 6.91%: 5 Key Factors Driving the Week’s Momentum

Announcements stock-summary

Announcement under Regulation 30 (LODR)-Newspaper Publication

09-Sep-2026 | Source : BSE

Copy of Newspapers Publication for 52nd AGM- MIDHANI

Announcement under Regulation 30 (LODR)-Appointment of Statutory Auditor/s

09-Sep-2026 | Source : BSE

Re-appointment of Statutory Auditors for FY 2026-27.

Reg. 34 (1) Annual Report.

08-Sep-2026 | Source : BSE

Annual Report for FY 2025-26 along with Notice of Annual General Meeting.

Corporate Actions stock-summary

stock-summary
BOARD MEETING

No Upcoming Board Meetings

stock-summary
DIVIDEND

Mishra Dhatu Nigam Ltd has declared 12% dividend, ex-date: 23 Sep 26

stock-summary
SPLITS

No Splits history available

stock-summary
BONUS

No Bonus history available

stock-summary
RIGHTS

No Rights history available

stock-summaryKey Factors

Quality key factors stock-summary

Factor
Value
Sales Growth (5y)
9.44%
EBIT Growth (5y)
-6.15%
EBIT to Interest (avg)
6.56
Debt to EBITDA (avg)
1.65
Net Debt to Equity (avg)
0.14
Sales to Capital Employed (avg)
0.58
Tax Ratio
28.84%
Dividend Payout Ratio
25.35%
Pledged Shares
0
Institutional Holding
9.94%
ROCE (avg)
11.46%
ROE (avg)
10.08%

Valuation key factors

Factor
Value
P/E Ratio
62
Industry P/E
25
Price to Book Value
5.48
EV to EBIT
49.73
EV to EBITDA
35.86
EV to Capital Employed
4.93
EV to Sales
6.74
PEG Ratio
4.48
Dividend Yield
0.18%
ROCE (Latest)
9.80%
ROE (Latest)
8.58%

Technicals key factors

Indicator
Weekly
Monthly
MACD
Mildly Bearish
Bullish
RSI
No Signal
No Signal
Bollinger Bands
Bullish
Bullish
Moving Averages
Bullish (Daily)
KST
Mildly Bearish
Bullish
Dow Theory
Mildly Bullish
Mildly Bullish
OBV
Bullish
Bullish
stock-summary Technical Indicator Scale: Bearish, Mildly Bearish, Sideways, Mildly Bullish, Bullish  Turned 
stock-summaryShareholding
Shareholding Snapshot : Jun 2026stock-summary
Shareholding Compare (%holding) stock-summary
Majority shareholders

Promoters

Pledged Promoter Holdings

None

Mutual Funds

Held by 9 Schemes (5.81%)

FIIs

Held by 79 FIIs (2.56%)

Promoter with highest holding

President Of India (74.0%)

Highest Public shareholder

Hdfc Trustee Company Ltd. A/c Hdfc Balanced Advantage Fund (3.44%)

Individual Investors Holdings

13.86%

stock-summaryFinancial
[
  {
    "link": "quarterly",
    "btn_text": "All Quarterly Results",
    "header": "Quarterly Results Snapshot (Consolidated) - Jun'26 - YoY",
    "rhs": [
      {
        "prefix": "Net Sales ",
        "suffix": "YoY Growth in quarter ended Jun 2026 is 40.46% vs 4.31% in Jun 2025",
        "dir": 1
      },
      {
        "prefix": "Consolidated Net Profit ",
        "suffix": "YoY Growth in quarter ended Jun 2026 is 26.99% vs 145.18% in Jun 2025",
        "dir": -1
      }
    ],
    "table": {
      "header": [
        "Jun'26",
        "Jun'25",
        "Change(%)"
      ],
      "body": [
        {
          "field": "Net Sales",
          "val1": "239.49",
          "val2": "170.50",
          "chgp": "40.46%",
          "chgp_class": "positive"
        },
        {
          "field": "Operating Profit (PBDIT) excl Other Income",
          "val1": "36.61",
          "val2": "34.18",
          "chgp": "7.11%",
          "chgp_class": "positive"
        },
        {
          "field": "Interest",
          "val1": "6.08",
          "val2": "6.17",
          "chgp": "-1.46%",
          "chgp_class": "positive"
        },
        {
          "field": "Exceptional Items",
          "val1": "0.00",
          "val2": "0.00",
          "chgp": "",
          "chgp_class": "neutral"
        },
        {
          "field": "Consolidate Net Profit",
          "val1": "16.47",
          "val2": "12.97",
          "chgp": "26.99%",
          "chgp_class": "positive"
        },
        {
          "field": "Operating Profit Margin (Excl OI)",
          "val1": "16.09%",
          "val2": "20.28%",
          "chgp": "-4.19%",
          "chgp_class": "negative"
        }
      ]
    }
  },
  {
    "link": "half-yearly",
    "btn_text": "All Half Yearly Results",
    "header": "Half Yearly Results Snapshot (Consolidated) - Sep'25",
    "rhs": [
      {
        "prefix": "Net Sales ",
        "suffix": " Growth in half year ended Sep 2025 is -10.66% vs 2.50% in Sep 2024",
        "dir": -1
      },
      {
        "prefix": "Consolidated Net Profit ",
        "suffix": " Growth in half year ended Sep 2025 is -10.96% vs -10.81% in Sep 2024",
        "dir": -1
      }
    ],
    "table": {
      "header": [
        "Sep'25",
        "Sep'24",
        "Change(%)"
      ],
      "body": [
        {
          "field": "Net Sales",
          "val1": "380.22",
          "val2": "425.57",
          "chgp": "-10.66%",
          "chgp_class": "negative"
        },
        {
          "field": "Operating Profit (PBDIT) excl Other Income",
          "val1": "66.92",
          "val2": "72.25",
          "chgp": "-7.38%",
          "chgp_class": "negative"
        },
        {
          "field": "Interest",
          "val1": "11.96",
          "val2": "14.73",
          "chgp": "-18.81%",
          "chgp_class": "positive"
        },
        {
          "field": "Exceptional Items",
          "val1": "0.00",
          "val2": "0.00",
          "chgp": "",
          "chgp_class": "neutral"
        },
        {
          "field": "Consolidate Net Profit",
          "val1": "25.92",
          "val2": "29.11",
          "chgp": "-10.96%",
          "chgp_class": "negative"
        },
        {
          "field": "Operating Profit Margin (Excl OI)",
          "val1": "17.78%",
          "val2": "17.52%",
          "chgp": "0.26%",
          "chgp_class": "positive"
        }
      ]
    }
  },
  {
    "link": "nine-monthly",
    "btn_text": "All Nine Monthly Results",
    "header": "Nine Monthly Results Snapshot (Consolidated) - Dec'25",
    "rhs": [
      {
        "prefix": "Net Sales ",
        "suffix": "YoY Growth in nine months ended Dec 2025 is -1.15% vs -0.55% in Dec 2024",
        "dir": -1
      },
      {
        "prefix": "Consolidated Net Profit ",
        "suffix": "YoY Growth in nine months ended Dec 2025 is -1.96% vs 20.22% in Dec 2024",
        "dir": -1
      }
    ],
    "table": {
      "header": [
        "Dec'25",
        "Dec'24",
        "Change(%)"
      ],
      "body": [
        {
          "field": "Net Sales",
          "val1": "655.88",
          "val2": "663.53",
          "chgp": "-1.15%",
          "chgp_class": "negative"
        },
        {
          "field": "Operating Profit (PBDIT) excl Other Income",
          "val1": "121.56",
          "val2": "124.69",
          "chgp": "-2.51%",
          "chgp_class": "negative"
        },
        {
          "field": "Interest",
          "val1": "18.30",
          "val2": "22.02",
          "chgp": "-16.89%",
          "chgp_class": "positive"
        },
        {
          "field": "Exceptional Items",
          "val1": "0.00",
          "val2": "0.00",
          "chgp": "",
          "chgp_class": "neutral"
        },
        {
          "field": "Consolidate Net Profit",
          "val1": "53.56",
          "val2": "54.63",
          "chgp": "-1.96%",
          "chgp_class": "negative"
        },
        {
          "field": "Operating Profit Margin (Excl OI)",
          "val1": "18.53%",
          "val2": "18.79%",
          "chgp": "-0.26%",
          "chgp_class": "negative"
        }
      ]
    }
  },
  {
    "link": "annual",
    "btn_text": "All Annual Results",
    "header": "Annual Results Snapshot (Consolidated) - Mar'26",
    "rhs": [
      {
        "prefix": "Net Sales ",
        "suffix": "YoY Growth in year ended Mar 2026 is 12.52% vs 0.13% in Mar 2025",
        "dir": 1
      },
      {
        "prefix": "Consolidated Net Profit ",
        "suffix": "YoY Growth in year ended Mar 2026 is 18.61% vs 20.77% in Mar 2025",
        "dir": -1
      }
    ],
    "table": {
      "header": [
        "Mar'26",
        "Mar'25",
        "Change(%)"
      ],
      "body": [
        {
          "field": "Net Sales",
          "val1": "1,208.62",
          "val2": "1,074.11",
          "chgp": "12.52%",
          "chgp_class": "positive"
        },
        {
          "field": "Operating Profit (PBDIT) excl Other Income",
          "val1": "237.57",
          "val2": "218.05",
          "chgp": "8.95%",
          "chgp_class": "positive"
        },
        {
          "field": "Interest",
          "val1": "25.05",
          "val2": "29.45",
          "chgp": "-14.94%",
          "chgp_class": "positive"
        },
        {
          "field": "Exceptional Items",
          "val1": "0.00",
          "val2": "0.00",
          "chgp": "",
          "chgp_class": "neutral"
        },
        {
          "field": "Consolidate Net Profit",
          "val1": "131.47",
          "val2": "110.84",
          "chgp": "18.61%",
          "chgp_class": "positive"
        },
        {
          "field": "Operating Profit Margin (Excl OI)",
          "val1": "20.10%",
          "val2": "20.71%",
          "chgp": "-0.61%",
          "chgp_class": "negative"
        }
      ]
    }
  }
]

Quarterly Results Snapshot (Consolidated) - Jun'26 - YoYstock-summary

Jun'26
Jun'25
Change(%)
Net Sales
239.49
170.50
40.46%
Operating Profit (PBDIT) excl Other Income
36.61
34.18
7.11%
Interest
6.08
6.17
-1.46%
Exceptional Items
0.00
0.00
Consolidate Net Profit
16.47
12.97
26.99%
Operating Profit Margin (Excl OI)
16.09%
20.28%
-4.19%
Values in Rs Cr.
Direction Arrows
Net Sales

YoY Growth in quarter ended Jun 2026 is 40.46% vs 4.31% in Jun 2025

Direction Arrows
Consolidated Net Profit

YoY Growth in quarter ended Jun 2026 is 26.99% vs 145.18% in Jun 2025

Half Yearly Results Snapshot (Consolidated) - Sep'25stock-summary

Sep'25
Sep'24
Change(%)
Net Sales
380.22
425.57
-10.66%
Operating Profit (PBDIT) excl Other Income
66.92
72.25
-7.38%
Interest
11.96
14.73
-18.81%
Exceptional Items
0.00
0.00
Consolidate Net Profit
25.92
29.11
-10.96%
Operating Profit Margin (Excl OI)
17.78%
17.52%
0.26%
Values in Rs Cr.
Direction Arrows
Net Sales

Growth in half year ended Sep 2025 is -10.66% vs 2.50% in Sep 2024

Direction Arrows
Consolidated Net Profit

Growth in half year ended Sep 2025 is -10.96% vs -10.81% in Sep 2024

Nine Monthly Results Snapshot (Consolidated) - Dec'25stock-summary

Dec'25
Dec'24
Change(%)
Net Sales
655.88
663.53
-1.15%
Operating Profit (PBDIT) excl Other Income
121.56
124.69
-2.51%
Interest
18.30
22.02
-16.89%
Exceptional Items
0.00
0.00
Consolidate Net Profit
53.56
54.63
-1.96%
Operating Profit Margin (Excl OI)
18.53%
18.79%
-0.26%
Values in Rs Cr.
Direction Arrows
Net Sales

YoY Growth in nine months ended Dec 2025 is -1.15% vs -0.55% in Dec 2024

Direction Arrows
Consolidated Net Profit

YoY Growth in nine months ended Dec 2025 is -1.96% vs 20.22% in Dec 2024

Annual Results Snapshot (Consolidated) - Mar'26stock-summary

Mar'26
Mar'25
Change(%)
Net Sales
1,208.62
1,074.11
12.52%
Operating Profit (PBDIT) excl Other Income
237.57
218.05
8.95%
Interest
25.05
29.45
-14.94%
Exceptional Items
0.00
0.00
Consolidate Net Profit
131.47
110.84
18.61%
Operating Profit Margin (Excl OI)
20.10%
20.71%
-0.61%
Values in Rs Cr.
Direction Arrows
Net Sales

YoY Growth in year ended Mar 2026 is 12.52% vs 0.13% in Mar 2025

Direction Arrows
Consolidated Net Profit

YoY Growth in year ended Mar 2026 is 18.61% vs 20.77% in Mar 2025

stock-summaryCompany CV
About Mishra Dhatu Nigam Ltd stock-summary
stock-summary
Mishra Dhatu Nigam Ltd
Small Cap
Aerospace & Defense
Mishra Dhatu Nigam Limited (MIDHANI ), a Public Sector Undertaking was set up in 1973 and is engaged in manufacturing of Super Alloys, Titanium base Alloys, Special Stainless Steel in semi-finished forms and other special metals. The Company is one of the leading manufacturers of Special Steels, Super Alloys and the only manufacturer of Titanium Alloys in India.
Company Coordinates stock-summary
Company Details
P O Kanchanbagh , Hyderabad Telangana : 500058
stock-summary
Tel: 91-40-24184000
stock-summary
secretary@midhani.com
Registrar Details
Alankit Assignments Ltd , 205-208 , Anarkali Complex, Jhandewala Extension, New Delhi