
Compare Mobavenue AI Tec with Similar Stocks
Stock DNA
Other Consumer Services
INR 2,367 Cr (Micro Cap)
82.00
180
0.06%
-0.70
32.41%
26.16
Total Returns (Price + Dividend) 
Latest dividend: 0.10146201045375353 per share ex-dividend date: Feb-20-2026
Risk Adjusted Returns v/s
Returns Beta

News

Mobavenue AI Tech Ltd is Rated Buy
Mobavenue AI Tech Ltd is rated Buy by MarketsMOJO, with this rating last updated on 04 June 2026. However, the analysis and financial metrics discussed here reflect the company’s current position as of 20 July 2026, providing investors with the most up-to-date view of the stock’s fundamentals, returns, and technical outlook.
Read full news article
Mobavenue AI Tech Ltd is Rated Buy
Mobavenue AI Tech Ltd is rated Buy by MarketsMOJO. This rating was last updated on 04 June 2026, reflecting a positive assessment of the stock’s prospects. However, all fundamentals, returns, and financial metrics discussed below are current as of 09 July 2026, providing investors with the latest view of the company’s performance and outlook.
Read full news article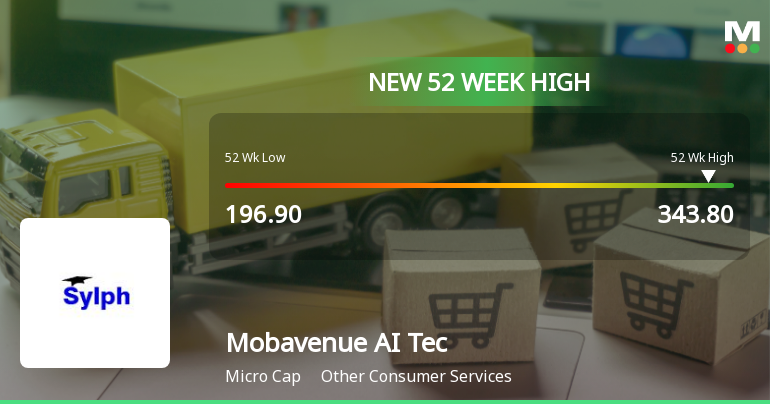
Broad-Based Technical Strength Lifts Mobavenue AI Tech Ltd to 52-Week High of Rs 343.8
With a decisive break above Rs 343.8 on 8 Jul 2026, Mobavenue AI Tech Ltd has reached a fresh 52-week high, extending its impressive 56% gain over the past year. This milestone comes amid a backdrop of strong technical momentum and sustained upward price action, even as the broader Sensex trades lower.
Read full news article Announcements
Mobavenue AI Tech Opens Singapore Hub To Scale AI-Native Adtech Across Southeast Asia.
16-Jul-2026 | Source : BSEMobavenue AI Tech opens singapore hub to scale AI-native AdTech across southeast asia.
Announcement under Regulation 30 (LODR)-Press Release / Media Release
16-Jul-2026 | Source : BSEMobavenue AI Tech opens Singapore Hub to Scale AI-Native AdTech Across Southeast Asia.
Compliances-Certificate under Reg. 74 (5) of SEBI (DP) Regulations 2018
10-Jul-2026 | Source : BSEMobavenue AI Tech Limited inform exchange about the Certificate under Regulation 74(5) of SEBI (Depositories and Participants) Regulations 2018 for the quarter ended on June 30 2026
Corporate Actions

No Upcoming Board Meetings

Mobavenue AI Tech Ltd has declared 5% dividend, ex-date: 20 Feb 26

Mobavenue AI Tech Ltd has announced 2:10 stock split, ex-date: 12 Jun 26

No Bonus history available

No Rights history available
Quality key factors
Valuation key factors
Technicals key factors
 Technical Indicator Scale: Bearish, Mildly Bearish, Sideways, Mildly Bullish, Bullish Turned
 Shareholding Snapshot : Jun 2026
Shareholding Compare (%holding)
Promoters
None
Held by 0 Schemes
Held by 0 FIIs
Kunal Hasmukh Kothari (21.87%)
Falguni Chandresh Lotia (12.38%)
31.11%
Quarterly Results Snapshot (Standalone) - Mar'26 - YoY

YoY Growth in quarter ended Mar 2026 is 23.89% vs 0.00% in Mar 2025

YoY Growth in quarter ended Mar 2026 is 14.14% vs 10,000.00% in Mar 2025
Half Yearly Results Snapshot (Standalone) - Sep'25
Growth in half year ended Sep 2025 is 0.00% vs 0.00% in Sep 2024
Growth in half year ended Sep 2025 is 1,150.00% vs -81.82% in Sep 2024
Nine Monthly Results Snapshot (Standalone) - Dec'25
YoY Growth in nine months ended Dec 2025 is 0.00% vs 0.00% in Dec 2024
YoY Growth in nine months ended Dec 2025 is 1,327.27% vs -83.33% in Dec 2024
Annual Results Snapshot (Standalone) - Mar'26
YoY Growth in year ended Mar 2026 is 313.27% vs 0.00% in Mar 2025
YoY Growth in year ended Mar 2026 is 396.10% vs 741.67% in Mar 2025
About Mobavenue AI Tech Ltd

Company Coordinates


