
Compare Modison with Similar Stocks
Dashboard
Strong ability to service debt as the company has a low Debt to EBITDA ratio of 1.49 times
With a growth in Operating Profit of 268.29%, the company declared Very Positive results in Mar 26
With ROCE of 24.1, it has a Attractive valuation with a 2.6 Enterprise value to Capital Employed
Consistent Returns over the last 3 years
Stock DNA
Other Electrical Equipment
INR 1,022 Cr (Micro Cap)
12.00
43
1.42%
0.63
28.74%
3.75
Total Returns (Price + Dividend) 
Latest dividend: 2.5 per share ex-dividend date: Dec-08-2025
Risk Adjusted Returns v/s
Returns Beta

News
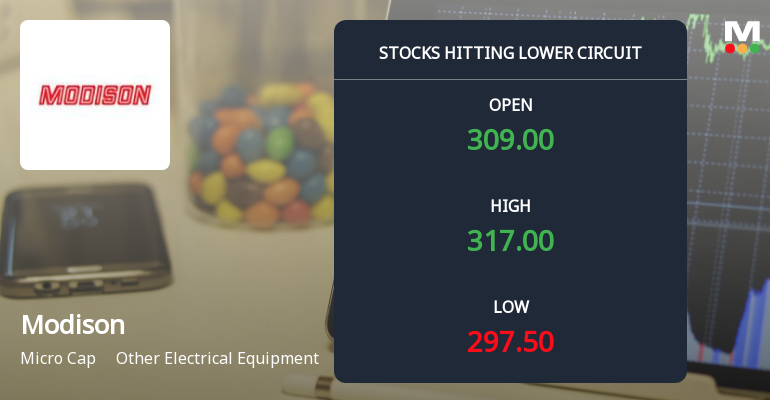
Modison Ltd Locks at Lower Circuit With 4.03% Loss — Sellers Queue, No Buyers in Sight
At Rs 309.00, sellers were still queuing — but there were no buyers willing to take the other side. Modison Ltd locked at its lower circuit of 4.03% on 12 Jun 2026, with unfilled sell orders and a frozen price, reflecting persistent selling pressure in a micro-cap stock with limited liquidity.
Read full news article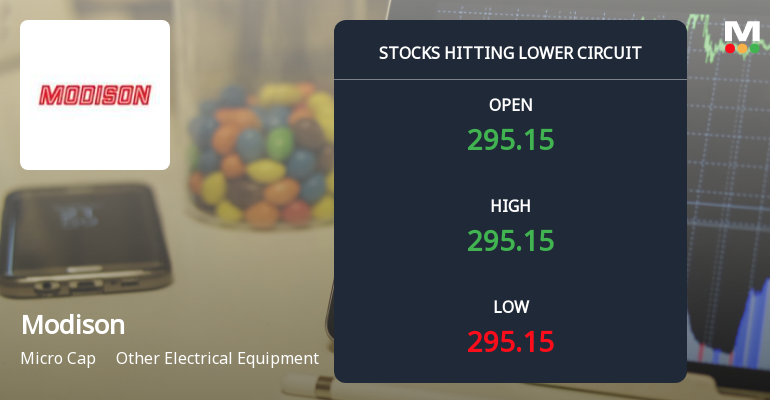
Modison Ltd Locks at Lower Circuit With 5.0% Loss — Sellers Queue, No Buyers in Sight
At Rs 295.5, sellers were still queuing — but there were no buyers willing to take the other side. Modison Ltd locked at its lower circuit of 5.0% on 11 Jun 2026, with unfilled sell orders and a frozen price, signalling a day dominated by supply overwhelming demand.
Read full news article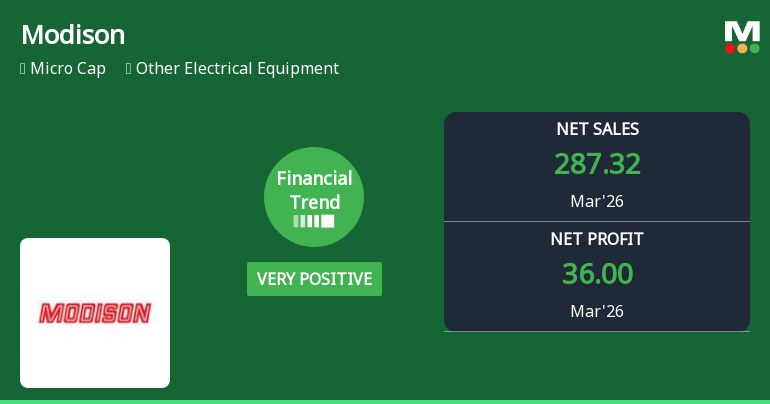
Modison Ltd Reports Strong Quarterly Gains Amid Positive Financial Trend Shift
Modison Ltd, a micro-cap player in the Other Electrical Equipment sector, has demonstrated robust financial performance in the quarter ended March 2026, signalling a positive shift in its financial trend. Despite a recent downgrade from a Strong Buy to a Buy rating, the company’s key metrics such as revenue, profitability, and return ratios have reached record highs, reflecting sustained operational strength amid challenging market conditions.
Read full news article Announcements
Announcement under Regulation 30 (LODR)-Analyst / Investor Meet - Intimation
01-Jun-2026 | Source : BSEIntimation of Investor Meet schedule on Thursday June 04 2026
Announcement under Regulation 30 (LODR)-Analyst / Investor Meet - Intimation
30-May-2026 | Source : BSEIntimation of Investor Meet schedule on June 03 2026
Compliances-Reg.24(A)-Annual Secretarial Compliance
29-May-2026 | Source : BSEAnnual Secretarial Compliance Report-March 31 2026
Corporate Actions

No Upcoming Board Meetings

Modison Ltd has declared 250% dividend, ex-date: 08 Dec 25

Modison Ltd has announced 1:10 stock split, ex-date: 03 Aug 07

No Bonus history available

No Rights history available
Quality key factors
Valuation key factors
Technicals key factors
 Technical Indicator Scale: Bearish, Mildly Bearish, Sideways, Mildly Bullish, Bullish Turned
 Shareholding Snapshot : Mar 2026
Shareholding Compare (%holding)
Promoters
None
Held by 0 Schemes
Held by 3 FIIs (0.48%)
Girdharilal Modi (23.37%)
Prakash Chandra Modi (14.33%)
43.64%
Quarterly Results Snapshot (Consolidated) - Mar'26 - QoQ

QoQ Growth in quarter ended Mar 2026 is 99.93% vs -1.00% in Dec 2025
QoQ Growth in quarter ended Mar 2026 is 79.46% vs 72.04% in Dec 2025
Half Yearly Results Snapshot (Consolidated) - Sep'25

Growth in half year ended Sep 2025 is 16.88% vs 30.44% in Sep 2024
Growth in half year ended Sep 2025 is 76.34% vs -16.08% in Sep 2024
Nine Monthly Results Snapshot (Consolidated) - Dec'25
YoY Growth in nine months ended Dec 2025 is 17.45% vs 23.78% in Dec 2024
YoY Growth in nine months ended Dec 2025 is 141.12% vs -0.39% in Dec 2024
Annual Results Snapshot (Consolidated) - Mar'26
YoY Growth in year ended Mar 2026 is 44.89% vs 21.18% in Mar 2025
YoY Growth in year ended Mar 2026 is 193.92% vs 15.54% in Mar 2025
About Modison Ltd

Company Coordinates


