
Compare Moneyboxx Fin. with Similar Stocks
Stock DNA
Non Banking Financial Company (NBFC)
INR 423 Cr (Micro Cap)
328.00
21
0.00%
2.28
0.45%
1.43
Total Returns (Price + Dividend) 
Moneyboxx Fin. for the last several years.
Risk Adjusted Returns v/s
Returns Beta

News

Moneyboxx Finance Ltd is Rated Strong Sell
Moneyboxx Finance Ltd is rated Strong Sell by MarketsMOJO. This rating was last updated on 18 May 2026. However, the analysis and financial metrics discussed here reflect the stock’s current position as of 13 July 2026, providing investors with the latest insights into the company’s performance and outlook.
Read full news article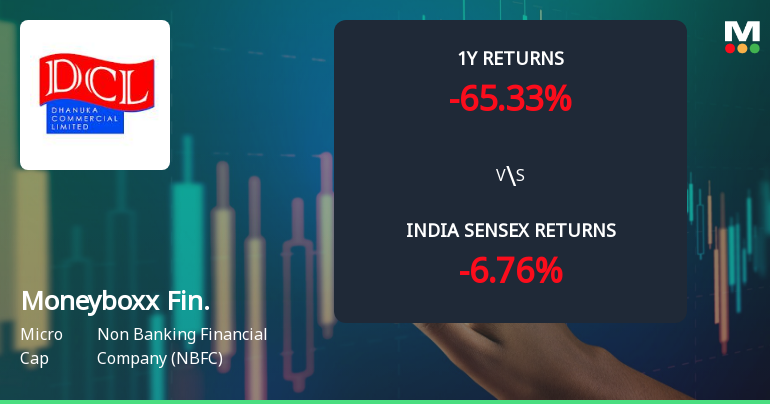
Moneyboxx Finance Ltd Technical Momentum Shifts Amid Bearish Sentiment
Moneyboxx Finance Ltd, a micro-cap player in the Non Banking Financial Company (NBFC) sector, has experienced a nuanced shift in its technical momentum, reflecting a complex interplay of bullish and bearish signals. Despite a modest day gain of 0.71%, the stock’s broader trend remains under pressure, with key indicators revealing mixed sentiments that investors should carefully analyse.
Read full news article
Moneyboxx Finance Ltd is Rated Strong Sell
Moneyboxx Finance Ltd is rated Strong Sell by MarketsMOJO, with this rating last updated on 18 May 2026. However, the analysis and financial metrics discussed here reflect the stock's current position as of 02 July 2026, providing investors with the latest insights into its performance and outlook.
Read full news article Announcements
Announcement under Regulation 30 (LODR)-Press Release / Media Release
14-Jul-2026 | Source : BSEPlease find attached the Press Release dated July 14 2026
Compliances-Certificate under Reg. 74 (5) of SEBI (DP) Regulations 2018
10-Jul-2026 | Source : BSEPlease find attached herewith the certificate with respect to the captioned subject.
Opening Of New Branch Office Of The Company.
08-Jul-2026 | Source : BSEPlease find attached herewith the intimation with respect to the opening of New Branch office of the Company at Poonamallee Tamil Nadu.
Corporate Actions

No Upcoming Board Meetings

No Dividend history available

No Splits history available

Moneyboxx Finance Ltd has announced 1:1 bonus issue, ex-date: 15 Dec 25

No Rights history available
Quality key factors
Valuation key factors
Technicals key factors
 Technical Indicator Scale: Bearish, Mildly Bearish, Sideways, Mildly Bullish, Bullish Turned
 Shareholding Snapshot : Mar 2026
Shareholding Compare (%holding)
Non Institution
7.1634
Held by 0 Schemes
Held by 1 FIIs (0.01%)
Moneyboxx Capital Private Limited (38.41%)
Alpna Gupta (2.27%)
48.38%
Quarterly Results Snapshot (Standalone) - Mar'26 - YoY

YoY Growth in quarter ended Mar 2026 is 21.22% vs 23.12% in Mar 2025

YoY Growth in quarter ended Mar 2026 is 108.88% vs -228.40% in Mar 2025
Half Yearly Results Snapshot (Standalone) - Sep'25
Growth in half year ended Sep 2025 is 19.87% vs 83.13% in Sep 2024
Growth in half year ended Sep 2025 is -91.79% vs 110.30% in Sep 2024
Nine Monthly Results Snapshot (Standalone) - Dec'25
YoY Growth in nine months ended Dec 2025 is 14.83% vs 71.99% in Dec 2024
YoY Growth in nine months ended Dec 2025 is -86.68% vs 30.08% in Dec 2024
Annual Results Snapshot (Standalone) - Mar'26
YoY Growth in year ended Mar 2026 is 16.50% vs 55.80% in Mar 2025
YoY Growth in year ended Mar 2026 is 7.20% vs -86.32% in Mar 2025
About Moneyboxx Finance Ltd

Company Coordinates


