
Compare Morganite Crucib with Similar Stocks
Dashboard
With ROE of 18.3, it has a Very Expensive valuation with a 5.4 Price to Book Value
- The stock is trading at a premium compared to its peers' average historical valuations
- Over the past year, while the stock has generated a return of -7.65%, its profits have fallen by -8.6%
Despite the size of the company, domestic mutual funds hold only 0% of the company
Underperformed the market in the last 1 year
Stock DNA
Electrodes & Refractories
INR 716 Cr (Micro Cap)
30.00
39
1.47%
-0.11
18.26%
5.35
Total Returns (Price + Dividend) 
Latest dividend: 19 per share ex-dividend date: Aug-14-2025
Risk Adjusted Returns v/s
Returns Beta

News
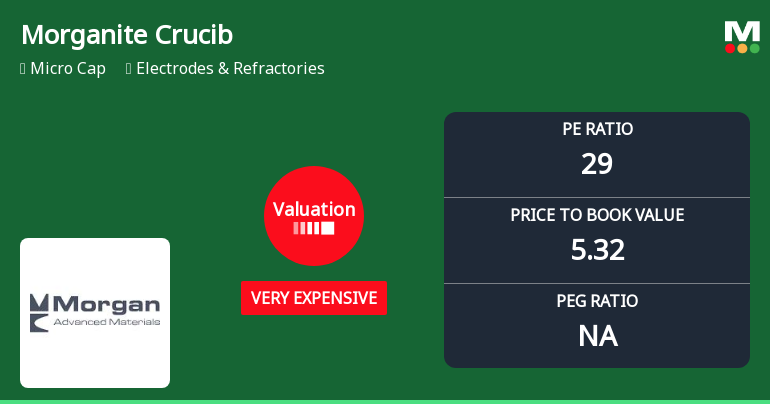
Morganite Crucible (India) Ltd Valuation Shifts Signal Elevated Price Risk
Morganite Crucible (India) Ltd has seen a marked shift in its valuation parameters, moving from an expensive to a very expensive rating, raising concerns about price attractiveness amid mixed returns and sector comparisons. This article analyses the recent changes in key valuation metrics, peer comparisons, and the implications for investors navigating the Electrodes & Refractories sector.
Read full news article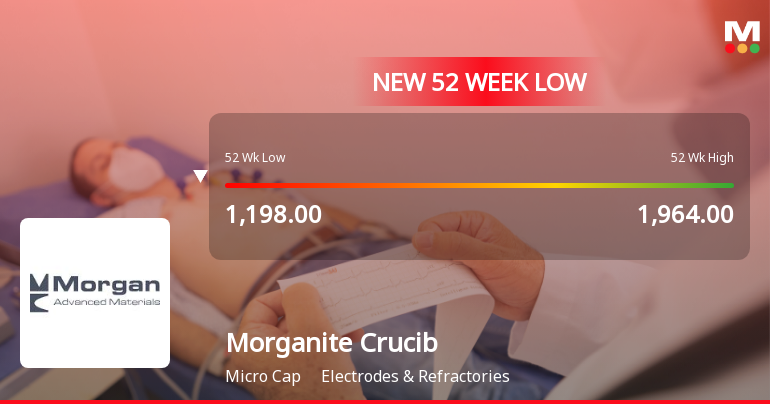
Morganite Crucible Falls to 52-Week Low of Rs 1167 Amidst Mixed Financial Signals
A sharp decline over the past two sessions has dragged Morganite Crucible (India) Ltd to a fresh 52-week low of Rs 1167 on 30 Mar 2026, reflecting persistent selling pressure despite pockets of operational strength.
Read full news article
Morganite Crucible (India) Ltd is Rated Sell
Morganite Crucible (India) Ltd is rated 'Sell' by MarketsMOJO. This rating was last updated on 05 Jan 2026, reflecting a shift in the stock’s outlook. However, the analysis and financial metrics discussed below represent the company’s current position as of 30 March 2026, providing investors with the latest insights into its performance and prospects.
Read full news article Announcements
Intimation Under Regulation 30 Of The SEBI (LODR) Regulations 2015
01-Apr-2026 | Source : BSEDisclosure under Regulation 30 of the SEBI (Listing Obligations and Disclosure Requirements) Regulations 2015 - Resignation by Senior Officer/official
Closure of Trading Window
26-Mar-2026 | Source : BSEIn terms of SEBI (Prohibition of Insider Trading) Regulations 2015 as amended from time to time and Code of Conduct for Prevention of Insider Trading of the Company the trading window shall remain closed for Promoter(s) promoter group Directors and other Designated Person/Employees of the Company from April 1 2026
Additional Details Required For Corporate Announcement Filed Under Regulation 30 Of SEBI (LODR) Regulations 2015 On 11-Feb-2026 08:18:06 PM Announcement Under Regulation 30 (LODR)-Resignation Of Chief Financial Officer (CFO)
06-Mar-2026 | Source : BSEThis is with reference to Corporate Announcement submitted by company dated 11-Feb-2026 08:18:06 PM under Regulation 30 of SEBI (Listing Obligations and Disclosure Requirements) Regulations 2015 regarding the submission of the resignation letter of the Chief Financial Officer (CFO).
Corporate Actions

No Upcoming Board Meetings

Morganite Crucible (India) Ltd has declared 380% dividend, ex-date: 14 Aug 25

Morganite Crucible (India) Ltd has announced 5:10 stock split, ex-date: 31 Aug 20

No Bonus history available

No Rights history available
Quality key factors
Valuation key factors
Technicals key factors
 Technical Indicator Scale: Bearish, Mildly Bearish, Sideways, Mildly Bullish, Bullish Turned
 Shareholding Snapshot : Dec 2025
Shareholding Compare (%holding)
Promoters
None
Held by 1 Schemes (0.0%)
Held by 1 FIIs (0.16%)
Foseco India Limited (75.0%)
Pgim India Equity Growth Opportunities Fund-series I (1.17%)
20.12%
Quarterly Results Snapshot (Standalone) - Dec'25 - QoQ

QoQ Growth in quarter ended Dec 2025 is 0.35% vs 7.97% in Sep 2025
QoQ Growth in quarter ended Dec 2025 is -36.56% vs 52.17% in Sep 2025
Half Yearly Results Snapshot (Standalone) - Sep'25

Growth in half year ended Sep 2025 is 1.46% vs -0.95% in Sep 2024
Growth in half year ended Sep 2025 is -13.44% vs 4.28% in Sep 2024
Nine Monthly Results Snapshot (Standalone) - Dec'25
YoY Growth in nine months ended Dec 2025 is 2.05% vs 2.98% in Dec 2024
YoY Growth in nine months ended Dec 2025 is -18.41% vs 8.21% in Dec 2024
Annual Results Snapshot (Standalone) - Mar'25
YoY Growth in year ended Mar 2025 is 3.73% vs 8.63% in Mar 2024
YoY Growth in year ended Mar 2025 is 17.24% vs 45.72% in Mar 2024
About Morganite Crucible (India) Ltd

Company Coordinates


