
Compare MOS Utility with Similar Stocks
Dashboard
High Management Efficiency with a high ROCE of 18.81%
Strong ability to service debt as the company has a low Debt to EBITDA ratio of 2.63 times
Healthy long term growth as Net Sales has grown by an annual rate of 84.40% and Operating profit at 55.87%
Flat results in Mar 26
With ROCE of 16.6, it has a Very Attractive valuation with a 2.7 Enterprise value to Capital Employed
Rising Promoter Confidence
Below par performance in long term as well as near term
Stock DNA
Financial Technology (Fintech)
INR 337 Cr (Micro Cap)
19.00
94
0.00%
0.27
16.91%
3.33
Total Returns (Price + Dividend) 
MOS Utility for the last several years.
Risk Adjusted Returns v/s
Returns Beta

News

MOS Utility Ltd Locks at Lower Circuit With 4.7% Loss — Sellers Queue, No Buyers in Sight
At Rs 13.10, sellers were still queuing — but there were no buyers willing to take the other side. MOS Utility Ltd locked at its lower circuit of 4.73% on 23 Jun 2026, with unfilled sell orders and a frozen price, reflecting persistent selling pressure in a thinly traded micro-cap stock.
Read full news article
MOS Utility Ltd is Rated Hold by MarketsMOJO
MOS Utility Ltd is rated 'Hold' by MarketsMOJO, a rating that was established on 26 May 2026. While this rating was set on that date, the analysis and financial metrics discussed here reflect the company’s current position as of 22 June 2026, providing investors with an up-to-date perspective on the stock’s fundamentals, valuation, financial trends, and technical outlook.
Read full news article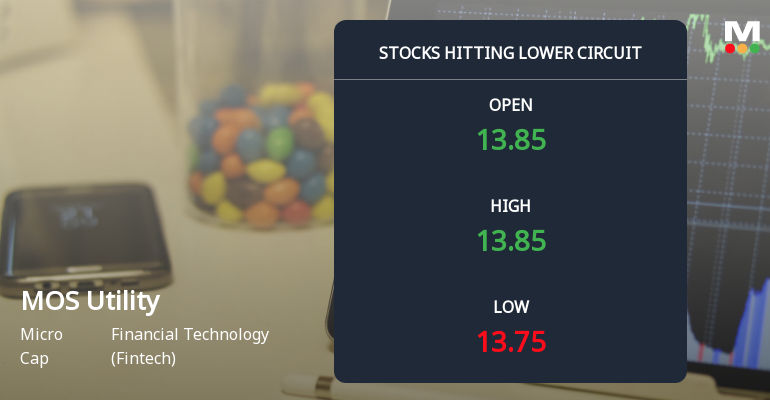
MOS Utility Ltd Locks at Lower Circuit With 4.84% Loss — Sellers Queue, No Buyers in Sight
At Rs 13.75, sellers were still queuing — but there were no buyers willing to take the other side. MOS Utility Ltd locked at its lower circuit of 4.84% on 22 Jun 2026, with unfilled sell orders and a frozen price, reflecting persistent selling pressure in a thinly traded micro-cap stock.
Read full news article Announcements
Corporate Actions

No Upcoming Board Meetings

No Dividend history available

MOS Utility Ltd has announced 2:10 stock split, ex-date: 08 Aug 25

MOS Utility Ltd has announced 1:1 bonus issue, ex-date: 14 Oct 25

No Rights history available
Quality key factors
Valuation key factors
Technicals key factors
 Technical Indicator Scale: Bearish, Mildly Bearish, Sideways, Mildly Bullish, Bullish Turned
 Shareholding Snapshot : Mar 2026
Shareholding Compare (%holding)
Promoters
7.9004
Held by 0 Schemes
Held by 8 FIIs (12.08%)
Kurjibhai Premjibhai Rupareliya (27.28%)
Pine Oak Global Fund (5.99%)
24.24%
Quarterly Results Snapshot (Standalone) - Mar'26 - QoQ

QoQ Growth in quarter ended Mar 2026 is -14.12% vs -12.33% in Dec 2025
QoQ Growth in quarter ended Mar 2026 is -5.07% vs 19.79% in Dec 2025
Half Yearly Results Snapshot (Consolidated) - Sep'25

Growth in half year ended Sep 2025 is 2.45% vs 0.01% in Mar 2025
Growth in half year ended Sep 2025 is 16.23% vs 32.78% in Mar 2025
Nine Monthly Results Snapshot (Consolidated) - Dec'25
YoY Growth in nine months ended Dec 2025 is 4.40% vs 94.70% in Mar 2026
YoY Growth in nine months ended Dec 2025 is 30.16% vs -3.78% in Mar 2026
Annual Results Snapshot (Consolidated) - Mar'26
YoY Growth in year ended Mar 2026 is 3.05% vs 230.06% in Mar 2025
YoY Growth in year ended Mar 2026 is 44.35% vs 2.80% in Mar 2025
About MOS Utility Ltd

Company Coordinates


