


Key Events This Week
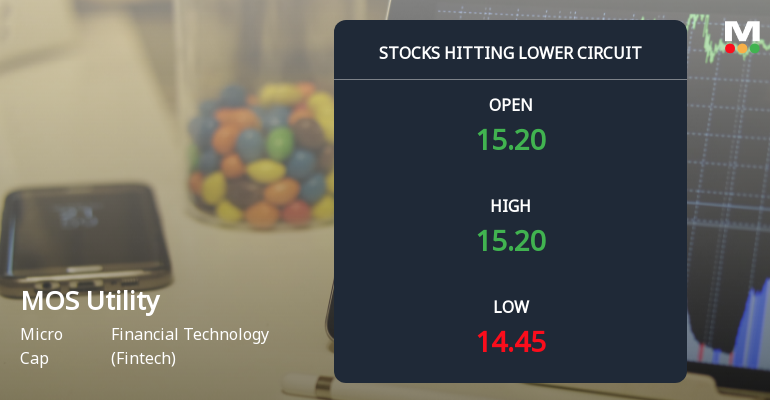
25 May: Stock opens strong at Rs.13.85, up 4.92%
26 May: Q4 FY26 results released; profit growth amid revenue decline
27 May: Quality grade upgraded to 'Good', stock gains 1.77%
29 May: Week closes at Rs.14.20, down 1.39% on final day

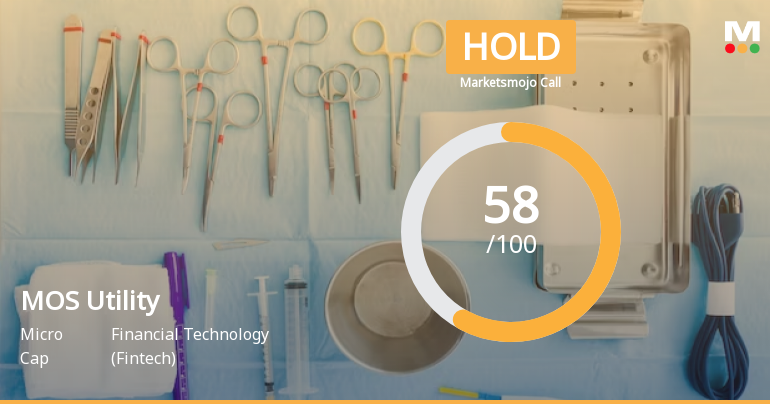
MOS Utility Ltd is Rated Hold by MarketsMOJO
2026-05-27 10:10:04MOS Utility Ltd is rated 'Hold' by MarketsMOJO, with this rating last updated on 26 May 2026. However, the analysis and financial metrics discussed here reflect the stock's current position as of 27 May 2026, providing investors with an up-to-date view of the company’s fundamentals, valuation, financial trends, and technical outlook.
Read full news article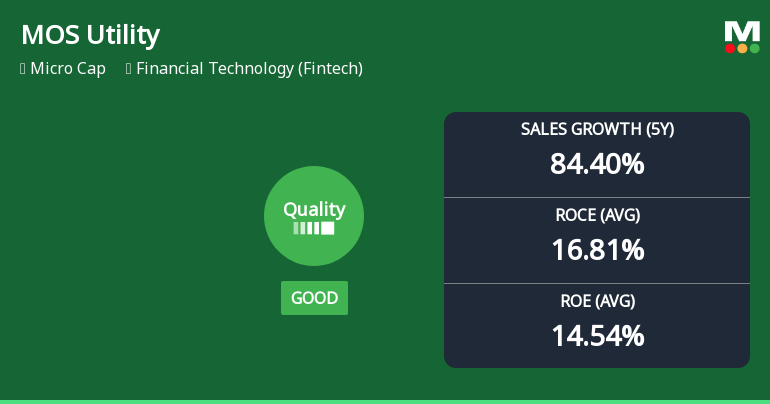
MOS Utility Ltd Quality Grade Upgrade Signals Improved Business Fundamentals
2026-05-27 08:00:18MOS Utility Ltd, a micro-cap player in the Financial Technology sector, has seen its quality rating upgraded from average to good, reflecting notable improvements in its business fundamentals. This upgrade is underpinned by strong sales and EBIT growth, robust return ratios, and prudent debt management, positioning the company favourably amid a challenging market backdrop.
Read full news article


