
Compare Moschip Tech. with Similar Stocks
Dashboard
Poor Management Efficiency with a low ROCE of 8.44%
- The company has been able to generate a Return on Capital Employed (avg) of 8.44% signifying low profitability per unit of total capital (equity and debt)
Negative results in Mar 26
With ROE of 9.8, it has a Expensive valuation with a 10.1 Price to Book Value
Reducing Promoter Confidence
Stock DNA
Software Products
INR 4,191 Cr (Small Cap)
103.00
20
0.00%
-0.15
9.84%
9.98
Total Returns (Price + Dividend) 
Latest dividend: 0.2 per share ex-dividend date: Aug-31-2017
Risk Adjusted Returns v/s
Returns Beta

News

Moschip Technologies Ltd is Rated Sell
Moschip Technologies Ltd is rated 'Sell' by MarketsMOJO. This rating was last updated on 21 May 2026, reflecting a reassessment of the stock’s outlook. However, the analysis and financial metrics presented here are based on the company’s current position as of 10 June 2026, providing investors with the most recent and relevant data to inform their decisions.
Read full news article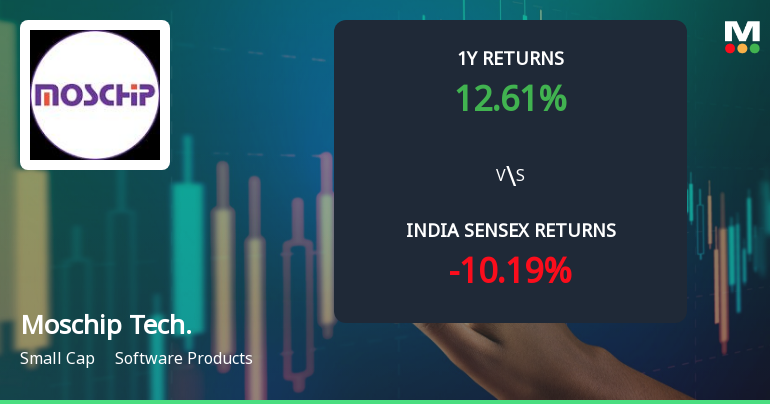
Moschip Technologies Ltd: Technical Momentum Shifts Amid Mixed Indicator Signals
Moschip Technologies Ltd, a small-cap player in the Software Products sector, has experienced a notable shift in its technical momentum, moving from a sideways trend to a mildly bullish stance. Despite a recent downgrade in its Mojo Grade from Hold to Sell, the stock exhibits a complex interplay of technical indicators that suggest cautious optimism for investors analysing price momentum and trend signals.
Read full news article
Moschip Technologies Ltd: Technical Momentum Shifts Amid Mixed Indicator Signals
Moschip Technologies Ltd, a small-cap player in the Software Products sector, has experienced a notable shift in its technical parameters, signalling a transition from a mildly bullish trend to a sideways momentum. Despite a recent downgrade in its Mojo Grade from Hold to Sell, the stock’s price action and technical indicators present a complex picture for investors navigating the current market environment.
Read full news article Announcements
Announcement under Regulation 30 (LODR)-Newspaper Publication
10-Jun-2026 | Source : BSENews paper Publication - Special window for re-lodgement of transfer of Physical shares.
Compliances-Reg.24(A)-Annual Secretarial Compliance
27-May-2026 | Source : BSEAnnual Secretarial Compliance Report for the year ended 31-March-2026.
Announcement under Regulation 30 (LODR)-Newspaper Publication
22-May-2026 | Source : BSENewspaper publication of Audited financials of the Company for the year ended 31-03-2026.
Corporate Actions

No Upcoming Board Meetings

Moschip Technologies Ltd has declared 10% dividend, ex-date: 31 Aug 17

No Splits history available

No Bonus history available

No Rights history available
Quality key factors
Valuation key factors
Technicals key factors
 Technical Indicator Scale: Bearish, Mildly Bearish, Sideways, Mildly Bullish, Bullish Turned
 Shareholding Snapshot : Mar 2026
Shareholding Compare (%holding)
Non Institution
None
Held by 0 Schemes
Held by 7 FIIs (0.4%)
Mayuka Holdings Private Limited (39.82%)
Smilax Corporate Services Llp (2.89%)
50.49%
Quarterly Results Snapshot (Consolidated) - Mar'26 - YoY

YoY Growth in quarter ended Mar 2026 is 13.75% vs 78.61% in Mar 2025
YoY Growth in quarter ended Mar 2026 is -8.73% vs 901.15% in Mar 2025
Half Yearly Results Snapshot (Consolidated) - Sep'25
Growth in half year ended Sep 2025 is 37.16% vs 59.85% in Sep 2024
Growth in half year ended Sep 2025 is 68.13% vs 100.73% in Sep 2024
Nine Monthly Results Snapshot (Consolidated) - Dec'25
YoY Growth in nine months ended Dec 2025 is 30.04% vs 52.02% in Dec 2024
YoY Growth in nine months ended Dec 2025 is 10.42% vs 174.61% in Dec 2024
Annual Results Snapshot (Consolidated) - Mar'26
YoY Growth in year ended Mar 2026 is 25.34% vs 58.84% in Mar 2025
YoY Growth in year ended Mar 2026 is 5.52% vs 237.65% in Mar 2025
About Moschip Technologies Ltd

Company Coordinates


