
Compare Motil.Oswal.Fin. with Similar Stocks
Stock DNA
Capital Markets
INR 52,408 Cr (Mid Cap)
27.00
20
0.70%
1.65
14.50%
3.97
Total Returns (Price + Dividend) 
Latest dividend: 6 per share ex-dividend date: Jan-30-2026
Risk Adjusted Returns v/s
Returns Beta

News

Motilal Oswal Financial Services Ltd Upgraded to Hold Amid Mixed Financial and Technical Signals
Motilal Oswal Financial Services Ltd has seen its investment rating upgraded from Sell to Hold as of 22 May 2026, reflecting a nuanced improvement in its technical outlook and sustained long-term fundamentals despite recent quarterly setbacks. The mid-cap capital markets firm’s revised Mojo Grade of 50.0 signals cautious optimism amid mixed financial trends and valuation concerns.
Read full news article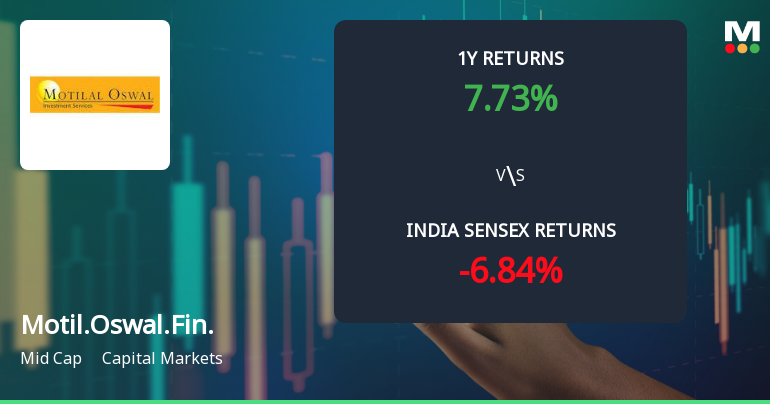
Motilal Oswal Financial Services Ltd Shows Mildly Bullish Momentum Amid Technical Shifts
Motilal Oswal Financial Services Ltd (MOFSL) has exhibited a notable shift in its technical momentum, transitioning from a sideways trend to a mildly bullish stance. This change is underscored by mixed signals from key technical indicators such as MACD, RSI, Bollinger Bands, and moving averages, reflecting a nuanced outlook for the capital markets mid-cap stock.
Read full news article
Motilal Oswal Financial Services Ltd is Rated Hold
Motilal Oswal Financial Services Ltd is rated 'Hold' by MarketsMOJO, with this rating last updated on 22 May 2026. While the rating change occurred on that date, the analysis and financial metrics presented here reflect the stock's current position as of 23 May 2026, providing investors with the most up-to-date view of the company’s performance and outlook.
Read full news article Announcements
Motilal Oswal Financial Services Limited - Analysts/Institutional Investor Meet/Con. Call Updates
28-Nov-2019 | Source : NSEMotilal Oswal Financial Services Limited Limited has informed the Exchange regarding Analysts/Institutional Investor Meet/Con. Call Updates
Motilal Oswal Financial Services Limited - Analysts/Institutional Investor Meet/Con. Call Updates
26-Nov-2019 | Source : NSEMotilal Oswal Financial Services Limited Limited has informed the Exchange regarding Analysts/Institutional Investor Meet/Con. Call Updates
Motilal Oswal Financial Services Limited - Analysts/Institutional Investor Meet/Con. Call Updates
21-Nov-2019 | Source : NSEMotilal Oswal Financial Services Limited Limited has informed the Exchange regarding Analysts/Institutional Investor Meet/Con. Call Updates
Corporate Actions

No Upcoming Board Meetings

Motilal Oswal Financial Services Ltd has declared 600% dividend, ex-date: 30 Jan 26

Motilal Oswal Financial Services Ltd has announced 1:5 stock split, ex-date: 25 Jul 08

Motilal Oswal Financial Services Ltd has announced 3:1 bonus issue, ex-date: 10 Jun 24

No Rights history available
Quality key factors
Valuation key factors
Technicals key factors
 Technical Indicator Scale: Bearish, Mildly Bearish, Sideways, Mildly Bullish, Bullish Turned
 Shareholding Snapshot : Mar 2026
Shareholding Compare (%holding)
Promoters
None
Held by 28 Schemes (4.94%)
Held by 226 FIIs (7.03%)
Raamdeo Ramgopal Agrawal (20.87%)
Navin Agarwal (5.07%)
10.73%
Quarterly Results Snapshot (Consolidated) - Mar'26 - YoY

YoY Growth in quarter ended Mar 2026 is 124.84% vs -44.74% in Mar 2025

YoY Growth in quarter ended Mar 2026 is -241.64% vs -108.96% in Mar 2025
Half Yearly Results Snapshot (Consolidated) - Sep'25
Growth in half year ended Sep 2025 is -11.04% vs 64.27% in Sep 2024
Growth in half year ended Sep 2025 is -23.85% vs 89.20% in Sep 2024
Nine Monthly Results Snapshot (Consolidated) - Dec'25
YoY Growth in nine months ended Dec 2025 is -6.31% vs 45.02% in Dec 2024
YoY Growth in nine months ended Dec 2025 is -18.55% vs 49.39% in Dec 2024
Annual Results Snapshot (Consolidated) - Mar'26
YoY Growth in year ended Mar 2026 is 12.41% vs 17.37% in Mar 2025
YoY Growth in year ended Mar 2026 is -25.28% vs 2.48% in Mar 2025
About Motilal Oswal Financial Services Ltd

Company Coordinates


