Nippon Life Ind.

  • Market Cap: Mid Cap
  • Industry: Capital Markets
  • ISIN: INE298J01013
  • NSEID: NAM-INDIA
  • BSEID: 540767
INR
1,202.00
37 (3.18%)
BSENSE

Aug 04, 03:30 PM

BSE+NSE Vol: 22.56 lacs

  • Price Points
  • Score
  • Mojo Parameters
  • Total Return
  • News and Corporate Actions
  • Key factors
  • Shareholding
  • Financials
  • CompanyCV
stock-summaryPrice Point
High/Low

1Day

52 Week

Valuation
Technical
Day's Volume

CASH

22.56 lacs (112.21%) Volume

Shareholding (Jun 2026)

FII

7.04%

Held by 312 FIIs

DII

15.49%

Held by 42 DIIs

Promoter

71.80%

Why is Nippon Life India Asset Management Ltd falling/rising?

04-Aug-2026

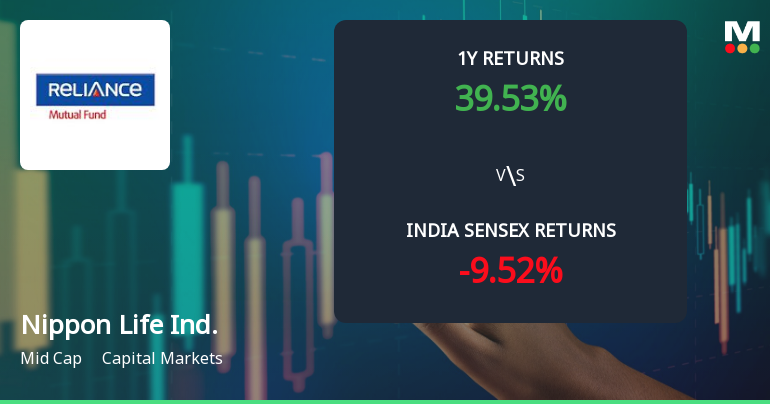
As of 03-Aug, Nippon Life India Asset Management Ltd's stock price is 1,161.15, reflecting a slight decline. The stock has underperformed its sector recently, and while it has strong long-term fundamentals, high valuation concerns may be contributing to the current price drop.

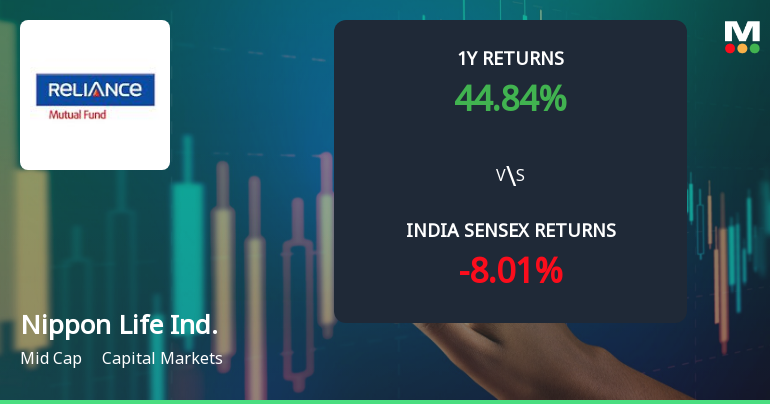
As of 03-Aug, Nippon Life India Asset Management Ltd's stock price is currently at 1,161.15, reflecting a slight decline of 0.25 (-0.02%). The stock has underperformed its sector today by 1.25%, which may contribute to the observed decrease in price. <BR><BR>In terms of recent performance, the stock has shown mixed results over various periods. While it has delivered a strong year-to-date return of 31.98% and a remarkable 44.36% over the past year, it has also experienced a decline of 4.60% over the last month, contrasting with a positive return of 1.13% for the Sensex during the same period. This recent underperformance could be influencing investor sentiment negatively.<BR><BR>Despite the current price drop, there are several positive factors supporting the stock's long-term outlook. The company has demonstrated strong fundamental strength, with an average Return on Equity (ROE) of 26.63% and significant growth in net sales and operating profit. The recent quarterly results have been very positive, showcasing the highest net sales and operating profit figures to date. Additionally, high institutional holdings at 22.53% indicate confidence from larger investors, who typically have more resources to analyze company fundamentals.<BR><BR>However, the stock's valuation is considered very expensive, trading at a premium compared to its peers, with a Price to Book Value of 15.9. This high valuation, combined with a PEG ratio of 2.2, suggests that while the stock has performed well historically, it may be perceived as overvalued at present, contributing to the downward pressure on its price.<BR><BR>Overall, the combination of recent underperformance relative to the sector, high valuation concerns, and mixed short-term performance may explain the current decline in Nippon Life India Asset Management Ltd's stock price.

View full answer

Should I buy, sell or hold Nippon Life India Asset Management Ltd?

03-Aug-2026

Are Nippon Life India Asset Management Ltd latest results good or bad?

23-Jul-2026

Nippon Life India Asset Management Ltd's latest Q1 FY27 results are strong, with a net profit of ₹503.70 crores, up 27.16% year-on-year, and impressive growth in net sales and operating margins. However, the stock is considered "Very Expensive," which may raise valuation concerns despite the solid operational performance.

Nippon Life India Asset Management Ltd's latest results for Q1 FY27 are quite strong, showcasing a solid operational performance. The company reported a consolidated net profit of ₹503.70 crores, which represents a year-on-year growth of 27.16% and a sequential growth of 30.93%. This indicates strong momentum in their asset management business, benefiting from favorable market conditions.<BR><BR>Net sales also saw impressive growth, reaching ₹766.87 crores, up 26.42% year-on-year and 3.81% quarter-on-quarter. The operating margin remains robust at 66.22%, reflecting the efficiency of their asset-light business model. Additionally, the return on equity (ROE) stands at an exceptional 32.83%, highlighting the company's effective capital utilization.<BR><BR>Overall, the results reflect a strong business performance, although the stock is currently classified as "Very Expensive," which may raise some valuation concerns. However, the underlying operational metrics suggest that the company is performing well in a growing market.

View full answer

What does Nippon Life Ind. do?

11-Jun-2026

Nippon Life India Asset Management Ltd is a leading asset management company in India, with a market cap of INR 68,876 Cr and a recent net profit of 385 Cr for Q1 2026. It operates in the Capital Markets industry and has a P/E ratio of 44.00.

Overview: <BR>Nippon Life India Asset Management Ltd is one of the largest asset management companies in India, operating within the Capital Markets industry and categorized as a Mid Cap company.<BR><BR>History: <BR>Nippon Life India Asset Management Ltd was formerly known as Reliance Nippon Life Asset Management Limited. The company has reported its latest quarterly results for March 2026, showcasing its financial performance.<BR><BR>Financial Snapshot: <BR>Most recent Net Sales: 739 Cr (Quarterly Results - Mar 2026) <BR>Most recent Net Profit: 385 Cr (Quarterly Results - Mar 2026) <BR>Market-cap value: INR 68,876 Cr (Mid Cap)<BR><BR>Key Metrics: <BR>P/E: 44.00 <BR>Industry P/E: 20 <BR>Dividend Yield: 1.74% <BR>Debt-Equity: 0.02 <BR>Return on Equity: 32.83% <BR>Price to Book: 14.88<BR><BR>Contact Details: <BR>Address: 4th Flr Tower A Peninsula Busi, Ganapatrao Kadam Marg L P (W) Mumbai Maharashtra : 400013 <BR>Phone: 91-22-68087000 <BR>Email: investorrelation@nipponindiaim.com <BR>Website: https://mf.nipponindiaim.com

View full answer

How big is Nippon Life Ind.?

11-Jun-2026

As of 10th June, Nippon Life India Asset Management Ltd has a market capitalization of 68,876.00 Cr and reported net sales of 2,708.74 Cr and net profit of 1,529.38 Cr over the latest four quarters.

As of 10th June, <BR><BR>Market Cap: Nippon Life India Asset Management Ltd has a market capitalization of 68,876.00 Cr, categorized as a Mid Cap company.<BR><BR>Recent Quarterly Performance: The sum of Net Sales for the latest 4 quarters is 2,708.74 Cr, while the sum of Net Profit for the same period is 1,529.38 Cr.<BR><BR>Balance Sheet Snapshot: The reporting period for the latest annual data is March 2025. Shareholder's Funds stand at 4,212.92 Cr, and Total Assets amount to 4,670.14 Cr.

View full answer

Who are in the management team of Nippon Life Ind.?

11-Jun-2026

The management team of Nippon Life Ind. includes Sundeep Sikka (CEO), U K Sinha (Chairperson), and several independent directors such as Ameeta Chatterjee and Ashvin Parekh, among others, overseeing the company's operations and strategy.

The management team of Nippon Life Ind. includes the following members:<BR><BR>1. **Sundeep Sikka** - Executive Director & CEO<BR>2. **Ameeta Chatterjee** - Independent Director<BR>3. **Ved Prakash Malik** - Independent Director<BR>4. **Nilufer Shekhawat** - Company Secretary & Compliance Officer<BR>5. **Ashvin Parekh** - Independent Director<BR>6. **B Sriram** - Independent Director<BR>7. **Minoru Kimura** - Director<BR>8. **Tomohiro Yao** - Director<BR>9. **U K Sinha** - Chairperson & Additional Director<BR>10. **Hiroki Yamauchi** - Director<BR><BR>This team is responsible for overseeing the operations and strategic direction of the company.

View full answer

Who are the peers of the Nippon Life Ind.?

11-Jun-2026

Nippon Life Ind.'s peers include HDFC AMC, Multi Comm. Exc., Motil. Oswal Fin., 360 ONE, Aditya AMC, Angel One, Anand Rathi Wealth, and BSE. Nippon Life Ind. has good management risk and growth, with a 1-year return of 39.68%, outperforming Motil. Oswal Fin. but trailing Multi Comm. Exc. at 80.28%.

Peers: The peers of Nippon Life Ind. are HDFC AMC, Multi Comm. Exc., Motil.Oswal.Fin., 360 ONE, Aditya AMC, Angel One, Anand Rathi Wea., and BSE.<BR><BR>Quality Snapshot: Excellent management risk is observed at HDFC AMC, Multi Comm. Exc., 360 ONE, Angel One, and BSE, while Good management risk is found at Motil.Oswal.Fin., Aditya AMC, Anand Rathi Wea., and Nippon Life Ind. Average management risk is present at none of the peers. Growth is Excellent at Multi Comm. Exc., Angel One, and BSE, while Good growth is seen at Nippon Life Ind., HDFC AMC, 360 ONE, and Anand Rathi Wea. Average growth is noted at Motil.Oswal.Fin. and Aditya AMC. Excellent capital structure is observed at HDFC AMC, Multi Comm. Exc., Nippon Life Ind., Motil.Oswal.Fin., 360 ONE, Aditya AMC, Angel One, Anand Rathi Wea., and BSE.<BR><BR>Return Snapshot: The peer with the highest 1-year return is Multi Comm. Exc. at 80.28%, while the lowest is Motil.Oswal.Fin. at -1.82%. Nippon Life Ind. has a 1-year return of 39.68%, which is significantly higher than Motil.Oswal.Fin. but lower than Multi Comm. Exc. Additionally, 360 ONE has a negative six-month return of -8.38%.

View full answer

Is Nippon Life Ind. technically bullish or bearish?

04-Nov-2025

As of November 3, 2025, the market trend is mildly bullish, supported by bullish MACD readings and daily moving averages, although the KST shows a mildly bearish trend that introduces some mixed signals.

As of 3 November 2025, the technical trend has changed from bullish to mildly bullish. The current stance is mildly bullish, driven by the weekly and monthly MACD readings, which are both bullish. The daily moving averages also support this bullish sentiment. However, the KST indicates a mildly bearish trend on both weekly and monthly time frames, which slightly offsets the overall bullish view. The Bollinger Bands reflect a mildly bullish stance as well. Overall, while there are some mixed signals, the prevailing indicators lean towards a mildly bullish outlook.

View full answer

Has Nippon Life Ind. declared dividend?

31-Oct-2025

Yes, Nippon Life India Asset Management Ltd has declared a 90% dividend, amounting to ₹10 per share, with an ex-date of November 6, 2025. The company has demonstrated strong total returns across various periods, reflecting solid financial performance.

Nippon Life India Asset Management Ltd has declared a 90% dividend.<BR><BR>Dividend Details:<BR>- Percentage announced: 90%<BR>- Amount per share: 10<BR>- Ex-date: 06 Nov 25<BR><BR>Dividend Yield: 2.06%.<BR><BR>Total Returns by Period:<BR>In the last 3 months, the price return was 7.77%, the dividend return was 1.11%, resulting in a total return of 8.88%.<BR><BR>Over the last 6 months, the price return reached 37.28%, with a dividend return of 2.91%, leading to a total return of 40.19%.<BR><BR>For the past year, the price return was 23.9%, the dividend return was 3.77%, culminating in a total return of 27.67%.<BR><BR>In the last 2 years, the price return was an impressive 124.01%, with a dividend return of 9.47%, resulting in a total return of 133.48%.<BR><BR>Over the past 3 years, the price return soared to 223.73%, while the dividend return was 19.47%, leading to a total return of 243.2%.<BR><BR>In the last 4 years, the price return was 109.82%, with a dividend return of 16.13%, resulting in a total return of 125.95%.<BR><BR>For the past 5 years, the price return was 222.53%, with a dividend return of 25.47%, culminating in a total return of 248.0%.<BR><BR>Overall, Nippon Life India Asset Management Ltd has shown a strong commitment to returning value to its shareholders through dividends, alongside significant total returns across various periods, indicating robust financial performance.

View full answer

How has been the historical performance of Nippon Life Ind.?

30-Oct-2025

Nippon Life Ind. has shown consistent growth, with net sales increasing from 1,062.14 Cr in Mar'21 to 2,230.69 Cr in Mar'25, and profit after tax rising from 415.76 Cr to 1,285.73 Cr in the same period, reflecting strong operational performance and profitability.

Answer:<BR>The historical performance of Nippon Life Ind. shows a consistent growth trajectory in net sales and profit over the years.<BR><BR>Breakdown:<BR>Nippon Life Ind. has demonstrated significant growth in net sales, increasing from 1,062.14 Cr in Mar'21 to 2,230.69 Cr in Mar'25. The total operating income followed a similar upward trend, reaching 2,230.69 Cr in Mar'25, up from 1,202.98 Cr in Mar'20. Operating profit (PBDIT) also saw a substantial rise, climbing to 1,731.66 Cr in Mar'25 from 598.73 Cr in Mar'20. Profit before tax increased to 1,694.32 Cr in Mar'25, compared to 559.81 Cr in Mar'20, while profit after tax reached 1,285.73 Cr in Mar'25, up from 415.76 Cr in Mar'20. The company's earnings per share (EPS) improved significantly from 6.78 in Mar'20 to 20.27 in Mar'25. On the balance sheet, total assets grew from 2,880.16 Cr in Mar'20 to 4,670.14 Cr in Mar'25, while total liabilities increased from 2,880.16 Cr to 4,670.14 Cr in the same period. Cash flow from operating activities rose to 1,199.00 Cr in Mar'25, up from 604.00 Cr in Mar'20, indicating strong operational performance. Overall, Nippon Life Ind. has shown robust growth in both revenue and profitability over the years.

View full answer

Who are the top shareholders of the Nippon Life Ind.?

17-Jul-2025

The top shareholders of Nippon Life Ind. include Nippon Life Insurance Company with 72.32%, Life Insurance Corporation of India at 3.69%, and individual investors at 5.34%. Mutual funds hold 8.0%, while foreign institutional investors account for 8.34%, with no pledged promoter holdings reported.

The top shareholders of Nippon Life Ind. include the Nippon Life Insurance Company, which holds a significant 72.32% of the shares. Other notable shareholders are Life Insurance Corporation of India with 3.69%, and individual investors who collectively hold 5.34%. Additionally, mutual funds account for 8.0% of the holdings through 29 schemes, while foreign institutional investors (FIIs) hold 8.34% through 257 entities. There are no pledged promoter holdings reported.

View full answer

Is Nippon Life Ind. overvalued or undervalued?

09-Jun-2025

As of June 30, 2023, Nippon Life India Asset Management Ltd. is considered very expensive with a PE ratio of 39.08 and an EV to EBITDA of 34.74, indicating overvaluation despite strong return metrics and significant outperformance compared to the Sensex.

As of 30 June 2023, the valuation grade for Nippon Life India Asset Management Ltd. moved from expensive to very expensive. The company is currently overvalued based on its financial ratios. It has a PE ratio of 39.08, a Price to Book Value of 11.93, and an EV to EBITDA of 34.74, all of which indicate a premium valuation compared to its peers.<BR><BR>In comparison, Nippon Life's peer, Nippon Life India Asset Management Ltd., also shows a very expensive valuation with a PE of 39.08 and an EV to EBITDA of 34.74. The company's strong return metrics, such as a ROCE of 35.16% and ROE of 30.53%, highlight its operational efficiency but do not justify the current high valuation. Additionally, the stock has outperformed the Sensex in various time frames, with a one-year return of 33.25% compared to the Sensex's 7.57%, further emphasizing the market's high expectations for future growth despite the current overvaluation.

View full answer

When is the next results date for Nippon Life Ind.?

06-Jun-2025

No Upcoming Board Meetings

iScoreScore
Part of MojoOne Strategy
Click here to find our call on this stock
Strong Sell
Sell
Hold
Buy
Strong Buy

Dashboard

1

Strong Long Term Fundamental Strength with an average Return on Equity (ROE) of 26.63%

  • Healthy long term growth as Net Sales has grown by an annual rate of 20.46% and Operating profit at 18.23%
2

With a growth in Net Profit of 27.15%, the company declared Very Positive results in Jun 26

3

High Institutional Holdings at 22.53%

4

Company is among the highest 1% of companies rated by MarketsMojo across all 4,000 stocks

 
5

Consistent Returns over the last 3 years

stock-summaryMojo Parameters

Mojo Parameters

Loading Valuation Snapshot...

Stock DNA

stock-summary
Industry

Capital Markets

stock-summary
Market cap

INR 76,204 Cr (Mid Cap)

stock-summary
P/E

47.00

stock-summary
Industry P/E

21

stock-summary
Dividend Yield

1.85%

stock-summary
Debt Equity

0.02

stock-summary
Return on Equity

32.83%

stock-summary
Price to Book

15.93

Revenue and Profits:
Net Sales:
767 Cr
(Quarterly Results - Jun 2026)
Net Profit:
504 Cr
stock-summaryTotal Returns
Total Returns (Price + Dividend) stock-summary
Dividend Yield (1.85%)
TimePeriod
Price Return
Dividend Return
Total Return
3 Months
17.92%
1.14%
19.06%
6 Months
29.75%
1.35%
31.1%
1 Year
47.84%
2.67%
50.51%
2 Years
87.71%
6.18%
93.89%
3 Years
286.43%
17.78%
304.21%
4 Years
301.27%
22.26%
323.53%
5 Years
193.85%
18.66%
212.51%

Latest dividend: 12.5 per share ex-dividend date: Jun-25-2026

Risk Adjusted Returns v/s stock-summary
Returns Beta
Icon
Beta has not been calculated since enough price history is not available
stock-summaryNews & Corporate Actions

News

Announcements stock-summary

Reliance Nippon Life Asset Management Limited - Other General Purpose

13-Nov-2019 | Source : NSE

Reliance Nippon Life Asset Management Limited has informed the Exchange regarding Compliance under Regulation 23(9) of the SEBI ( LODR) Regulations, 2015.

Reliance Nippon Life Asset Management Limited - Clarification - Financial Results

05-Nov-2019 | Source : NSE

Reliance Nippon Life Asset Management Limited Life Asset Management Limited for the quarter ended 30-Sep-2019 with respect to Regulation 33 of the SEBI (Listing Obligations and Disclosure Requirements) Regulations, 2015. On basis of above the Company is required to clarify the following: -1. Consolidated Segment details not submitted The response of the Company is awaited.

Reliance Nippon Life Asset Management Limited - Analysts/Institutional Investor Meet/Con. Call Updat

25-Oct-2019 | Source : NSE

Reliance Nippon Life Asset Management Limited Limited has informed the Exchange regarding Analysts/Institutional Investor Meet/Con. Call Updates

Corporate Actions stock-summary

stock-summary
BOARD MEETING

No Upcoming Board Meetings

stock-summary
DIVIDEND

Nippon Life India Asset Management Ltd has declared 125% dividend, ex-date: 25 Jun 26

stock-summary
SPLITS

No Splits history available

stock-summary
BONUS

No Bonus history available

stock-summary
RIGHTS

No Rights history available

stock-summaryKey Factors

Quality key factors stock-summary

Factor
Value
Sales Growth (5y)
20.46%
EBIT Growth (5y)
18.23%
Net Debt to Equity (avg)
0.02
Institutional Holding
22.53%
ROE (avg)
26.63%

Valuation key factors

Factor
Value
P/E Ratio
47
Industry P/E
21
Price to Book Value
16.41
EV to EBIT
40.75
EV to EBITDA
39.82
EV to Capital Employed
17.20
EV to Sales
26.57
PEG Ratio
2.28
Dividend Yield
1.79%
ROCE (Latest)
39.59%
ROE (Latest)
32.83%

Technicals key factors

Indicator
Weekly
Monthly
MACD
Mildly Bearish
Bullish
RSI
No Signal
No Signal
Bollinger Bands
Bullish
Bullish
Moving Averages
Bullish (Daily)
KST
Bullish
Bullish
Dow Theory
Mildly Bearish
No Trend
OBV
Mildly Bearish
No Trend
stock-summary Technical Indicator Scale: Bearish, Mildly Bearish, Sideways, Mildly Bullish, Bullish  Turned 
stock-summaryShareholding
Shareholding Snapshot : Jun 2026stock-summary
Shareholding Compare (%holding) stock-summary
Majority shareholders

Promoters

Pledged Promoter Holdings

None

Mutual Funds

Held by 37 Schemes (11.05%)

FIIs

Held by 312 FIIs (7.04%)

Promoter with highest holding

Nippon Life Insurance Company (71.8%)

Highest Public shareholder

Life Insurance Corporation Of India (2.25%)

Individual Investors Holdings

4.52%

stock-summaryFinancial
[
  {
    "link": "quarterly",
    "btn_text": "All Quarterly Results",
    "header": "Quarterly Results Snapshot (Consolidated) - Jun'26 - YoY",
    "rhs": [
      {
        "prefix": "Net Sales ",
        "suffix": "YoY Growth in quarter ended Jun 2026 is 26.42% vs 20.13% in Jun 2025",
        "dir": 1
      },
      {
        "prefix": "Consolidated Net Profit ",
        "suffix": "YoY Growth in quarter ended Jun 2026 is 27.16% vs 19.19% in Jun 2025",
        "dir": 1
      }
    ],
    "table": {
      "header": [
        "Jun'26",
        "Jun'25",
        "Change(%)"
      ],
      "body": [
        {
          "field": "Net Sales",
          "val1": "766.87",
          "val2": "606.61",
          "chgp": "26.42%",
          "chgp_class": "positive"
        },
        {
          "field": "Operating Profit (PBDIT) excl Other Income",
          "val1": "507.81",
          "val2": "388.13",
          "chgp": "30.84%",
          "chgp_class": "positive"
        },
        {
          "field": "Interest",
          "val1": "1.57",
          "val2": "1.80",
          "chgp": "-12.78%",
          "chgp_class": "positive"
        },
        {
          "field": "Exceptional Items",
          "val1": "0.00",
          "val2": "0.00",
          "chgp": "",
          "chgp_class": "neutral"
        },
        {
          "field": "Consolidate Net Profit",
          "val1": "503.70",
          "val2": "396.12",
          "chgp": "27.16%",
          "chgp_class": "positive"
        },
        {
          "field": "Operating Profit Margin (Excl OI)",
          "val1": "66.22%",
          "val2": "63.98%",
          "chgp": "2.24%",
          "chgp_class": "positive"
        }
      ]
    }
  },
  {
    "link": "half-yearly",
    "btn_text": "All Half Yearly Results",
    "header": "Half Yearly Results Snapshot (Consolidated) - Sep'25",
    "rhs": [
      {
        "prefix": "Net Sales ",
        "suffix": " Growth in half year ended Sep 2025 is 17.51% vs 43.19% in Sep 2024",
        "dir": -1
      },
      {
        "prefix": "Consolidated Net Profit ",
        "suffix": " Growth in half year ended Sep 2025 is 6.98% vs 44.22% in Sep 2024",
        "dir": -1
      }
    ],
    "table": {
      "header": [
        "Sep'25",
        "Sep'24",
        "Change(%)"
      ],
      "body": [
        {
          "field": "Net Sales",
          "val1": "1,264.73",
          "val2": "1,076.26",
          "chgp": "17.51%",
          "chgp_class": "positive"
        },
        {
          "field": "Operating Profit (PBDIT) excl Other Income",
          "val1": "817.67",
          "val2": "690.77",
          "chgp": "18.37%",
          "chgp_class": "positive"
        },
        {
          "field": "Interest",
          "val1": "3.60",
          "val2": "3.29",
          "chgp": "9.42%",
          "chgp_class": "negative"
        },
        {
          "field": "Exceptional Items",
          "val1": "0.00",
          "val2": "0.00",
          "chgp": "",
          "chgp_class": "neutral"
        },
        {
          "field": "Consolidate Net Profit",
          "val1": "740.76",
          "val2": "692.43",
          "chgp": "6.98%",
          "chgp_class": "positive"
        },
        {
          "field": "Operating Profit Margin (Excl OI)",
          "val1": "64.65%",
          "val2": "64.18%",
          "chgp": "0.47%",
          "chgp_class": "positive"
        }
      ]
    }
  },
  {
    "link": "nine-monthly",
    "btn_text": "All Nine Monthly Results",
    "header": "Nine Monthly Results Snapshot (Consolidated) - Dec'25",
    "rhs": [
      {
        "prefix": "Net Sales ",
        "suffix": "YoY Growth in nine months ended Dec 2025 is 18.38% vs 41.64% in Dec 2024",
        "dir": -1
      },
      {
        "prefix": "Consolidated Net Profit ",
        "suffix": "YoY Growth in nine months ended Dec 2025 is 15.88% vs 29.22% in Dec 2024",
        "dir": -1
      }
    ],
    "table": {
      "header": [
        "Dec'25",
        "Dec'24",
        "Change(%)"
      ],
      "body": [
        {
          "field": "Net Sales",
          "val1": "1,970.01",
          "val2": "1,664.15",
          "chgp": "18.38%",
          "chgp_class": "positive"
        },
        {
          "field": "Operating Profit (PBDIT) excl Other Income",
          "val1": "1,287.79",
          "val2": "1,076.46",
          "chgp": "19.63%",
          "chgp_class": "positive"
        },
        {
          "field": "Interest",
          "val1": "5.37",
          "val2": "4.94",
          "chgp": "8.70%",
          "chgp_class": "negative"
        },
        {
          "field": "Exceptional Items",
          "val1": "0.00",
          "val2": "0.00",
          "chgp": "",
          "chgp_class": "neutral"
        },
        {
          "field": "Consolidate Net Profit",
          "val1": "1,144.66",
          "val2": "987.79",
          "chgp": "15.88%",
          "chgp_class": "positive"
        },
        {
          "field": "Operating Profit Margin (Excl OI)",
          "val1": "65.37%",
          "val2": "64.69%",
          "chgp": "0.68%",
          "chgp_class": "positive"
        }
      ]
    }
  },
  {
    "link": "annual",
    "btn_text": "All Annual Results",
    "header": "Annual Results Snapshot (Consolidated) - Mar'26",
    "rhs": [
      {
        "prefix": "Net Sales ",
        "suffix": "YoY Growth in year ended Mar 2026 is 21.43% vs 35.75% in Mar 2025",
        "dir": -1
      },
      {
        "prefix": "Consolidated Net Profit ",
        "suffix": "YoY Growth in year ended Mar 2026 is 18.89% vs 16.17% in Mar 2025",
        "dir": 1
      }
    ],
    "table": {
      "header": [
        "Mar'26",
        "Mar'25",
        "Change(%)"
      ],
      "body": [
        {
          "field": "Net Sales",
          "val1": "2,708.74",
          "val2": "2,230.69",
          "chgp": "21.43%",
          "chgp_class": "positive"
        },
        {
          "field": "Operating Profit (PBDIT) excl Other Income",
          "val1": "1,794.91",
          "val2": "1,441.63",
          "chgp": "24.51%",
          "chgp_class": "positive"
        },
        {
          "field": "Interest",
          "val1": "7.00",
          "val2": "6.74",
          "chgp": "3.86%",
          "chgp_class": "negative"
        },
        {
          "field": "Exceptional Items",
          "val1": "0.00",
          "val2": "0.00",
          "chgp": "",
          "chgp_class": "neutral"
        },
        {
          "field": "Consolidate Net Profit",
          "val1": "1,529.38",
          "val2": "1,286.39",
          "chgp": "18.89%",
          "chgp_class": "positive"
        },
        {
          "field": "Operating Profit Margin (Excl OI)",
          "val1": "66.26%",
          "val2": "64.63%",
          "chgp": "1.63%",
          "chgp_class": "positive"
        }
      ]
    }
  }
]

Quarterly Results Snapshot (Consolidated) - Jun'26 - YoYstock-summary

Jun'26
Jun'25
Change(%)
Net Sales
766.87
606.61
26.42%
Operating Profit (PBDIT) excl Other Income
507.81
388.13
30.84%
Interest
1.57
1.80
-12.78%
Exceptional Items
0.00
0.00
Consolidate Net Profit
503.70
396.12
27.16%
Operating Profit Margin (Excl OI)
66.22%
63.98%
2.24%
Values in Rs Cr.
Direction Arrows
Net Sales

YoY Growth in quarter ended Jun 2026 is 26.42% vs 20.13% in Jun 2025

Direction Arrows
Consolidated Net Profit

YoY Growth in quarter ended Jun 2026 is 27.16% vs 19.19% in Jun 2025

Half Yearly Results Snapshot (Consolidated) - Sep'25stock-summary

Sep'25
Sep'24
Change(%)
Net Sales
1,264.73
1,076.26
17.51%
Operating Profit (PBDIT) excl Other Income
817.67
690.77
18.37%
Interest
3.60
3.29
9.42%
Exceptional Items
0.00
0.00
Consolidate Net Profit
740.76
692.43
6.98%
Operating Profit Margin (Excl OI)
64.65%
64.18%
0.47%
Values in Rs Cr.
Direction Arrows
Net Sales

Growth in half year ended Sep 2025 is 17.51% vs 43.19% in Sep 2024

Direction Arrows
Consolidated Net Profit

Growth in half year ended Sep 2025 is 6.98% vs 44.22% in Sep 2024

Nine Monthly Results Snapshot (Consolidated) - Dec'25stock-summary

Dec'25
Dec'24
Change(%)
Net Sales
1,970.01
1,664.15
18.38%
Operating Profit (PBDIT) excl Other Income
1,287.79
1,076.46
19.63%
Interest
5.37
4.94
8.70%
Exceptional Items
0.00
0.00
Consolidate Net Profit
1,144.66
987.79
15.88%
Operating Profit Margin (Excl OI)
65.37%
64.69%
0.68%
Values in Rs Cr.
Direction Arrows
Net Sales

YoY Growth in nine months ended Dec 2025 is 18.38% vs 41.64% in Dec 2024

Direction Arrows
Consolidated Net Profit

YoY Growth in nine months ended Dec 2025 is 15.88% vs 29.22% in Dec 2024

Annual Results Snapshot (Consolidated) - Mar'26stock-summary

Mar'26
Mar'25
Change(%)
Net Sales
2,708.74
2,230.69
21.43%
Operating Profit (PBDIT) excl Other Income
1,794.91
1,441.63
24.51%
Interest
7.00
6.74
3.86%
Exceptional Items
0.00
0.00
Consolidate Net Profit
1,529.38
1,286.39
18.89%
Operating Profit Margin (Excl OI)
66.26%
64.63%
1.63%
Values in Rs Cr.
Direction Arrows
Net Sales

YoY Growth in year ended Mar 2026 is 21.43% vs 35.75% in Mar 2025

Direction Arrows
Consolidated Net Profit

YoY Growth in year ended Mar 2026 is 18.89% vs 16.17% in Mar 2025

stock-summaryCompany CV
About Nippon Life India Asset Management Ltd stock-summary
stock-summary
Nippon Life India Asset Management Ltd
Mid Cap
Capital Markets
Nippon Life India Asset Management Limited (Formerly known as Reliance Nippon Life Asset Management Limited) is one of the largest asset management companies in India with a total AUM of Rs. 7,73,481 Crore as of March 31, 2026. Company acts as the Asset Manager to Nippon India Mutual Fund (NIMF).
Company Coordinates stock-summary
Company Details
4th Flr Tower A Peninsula Busi, Ganapatrao Kadam Marg L P (W) Mumbai Maharashtra : 400013
stock-summary
Tel: 91-22-68087000
stock-summary
investorrelation@nipponindiaim.com
Registrar Details
Karvy Computershare Pvt Ltd., Karvy Selenium, Tower-B Plot No 31 & 32, Survey No 116/22, 115/24, 115/25, Financial District, Nanakramguda, Serilingampally, Mandal Ranga Reddy Dist, Hyderabad