
Compare Motisons Jewel with Similar Stocks
Stock DNA
Gems, Jewellery And Watches
INR 1,691 Cr (Small Cap)
25.00
NA
0.00%
0.05
12.81%
3.24
Total Returns (Price + Dividend) 
Motisons Jewel for the last several years.
Risk Adjusted Returns v/s
Returns Beta

News
Motisons Jewellers Ltd Surges 9.23% to Day's High — Outperforms Sector by 5.8 Percentage Points
The Sensex advanced 0.56% on 6 Jul 2026, yet Motisons Jewellers Ltd outpaced the broader market with a robust 9.23% gain, outperforming its sector by 5.8 percentage points. This sharp single-session rally rewrites the short-term narrative for the small-cap jewellery stock, raising the question of whether this surge signals a sustained breakout or a technical bounce within a mixed trend.
Read full news article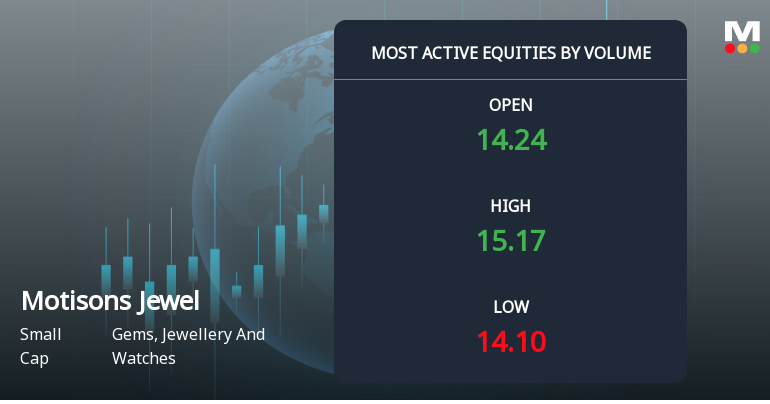
Motisons Jewellers Ltd Sees Exceptional Volume Surge Amid Mixed Technical Signals
Motisons Jewellers Ltd, a small-cap player in the Gems, Jewellery and Watches sector, witnessed one of the highest trading volumes on 6 July 2026, with over 93.5 lakh shares exchanging hands. Despite a modest 3.59% day change, the stock’s volume surge and technical indicators suggest a complex interplay of accumulation and distribution signals, warranting close attention from investors.
Read full news article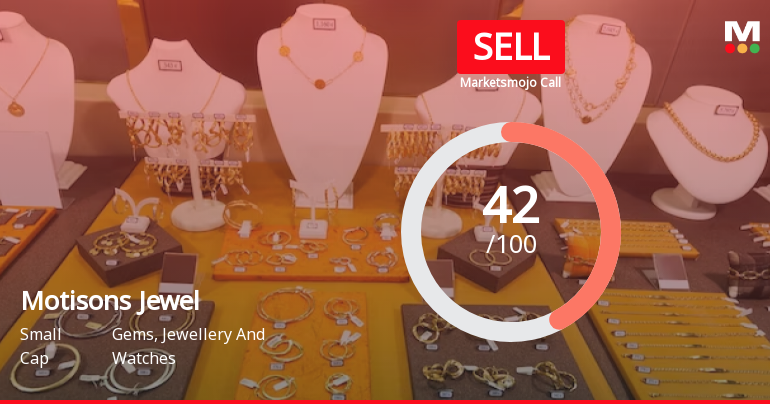
Motisons Jewellers Ltd is Rated Sell
Motisons Jewellers Ltd is rated Sell by MarketsMOJO. This rating was last updated on 22 May 2026, reflecting a shift from the previous Hold status. However, all fundamentals, returns, and financial metrics discussed here are current as of 03 July 2026, providing investors with an up-to-date view of the stock’s position.
Read full news article Announcements
Closure of Trading Window
24-Jun-2026 | Source : BSEPursuant to the provisions of Securities and Exchange Board of India (Prohibition of Insider Trading) Regulations 2015 and Companys Code of Conduct for Prevention of Insider Trading we wish to inform you that trading window for dealing in securities of the Company by all the Designated Persons and their immediate relatives will be closed from Wednesday July 01 2026 till 48 hours after the declaration of Un-audited Financial Results of the Company for the quarter ended on June 30 2026.
Announcement under Regulation 30 (LODR)-Allotment
11-Jun-2026 | Source : BSEDisclosure of the details of allotment in the Issue (as defined hereinafter) by Motisons Jewellers Limited (the Company) in accordance with the Securities and Exchange Board of India (Listing Obligations and Disclosures Requirements) 2015 as amended (the SEBI Listing Regulations) as attached.
Board Meeting Outcome for Outcome Of Meeting Of Board Of Directors Held On June 11 2026.
11-Jun-2026 | Source : BSEOutcome of Meeting of Board of Directors held on June 11 2026 as attached
Corporate Actions

No Upcoming Board Meetings

No Dividend history available

Motisons Jewellers Ltd has announced 1:10 stock split, ex-date: 08 Nov 24

No Bonus history available

No Rights history available
Quality key factors
Valuation key factors
Technicals key factors
 Technical Indicator Scale: Bearish, Mildly Bearish, Sideways, Mildly Bullish, Bullish Turned
 Shareholding Snapshot : Mar 2026
Shareholding Compare (%holding)
Promoters
None
Held by 0 Schemes
Held by 8 FIIs (2.02%)
Motisons Global Private Limited (18.25%)
Umesh Parasmal Pagariya (1.4%)
26.5%
Quarterly Results Snapshot (Standalone) - Mar'26 - QoQ

QoQ Growth in quarter ended Mar 2026 is -21.25% vs 92.95% in Dec 2025
QoQ Growth in quarter ended Mar 2026 is -68.00% vs 21.05% in Dec 2025
Half Yearly Results Snapshot (Standalone) - Sep'25
Growth in half year ended Sep 2025 is -10.37% vs 11.98% in Sep 2024

Growth in half year ended Sep 2025 is 76.09% vs 56.94% in Sep 2024
Nine Monthly Results Snapshot (Standalone) - Dec'25
YoY Growth in nine months ended Dec 2025 is 2.54% vs 14.42% in Dec 2024
YoY Growth in nine months ended Dec 2025 is 72.96% vs 49.39% in Dec 2024
Annual Results Snapshot (Standalone) - Mar'26
YoY Growth in year ended Mar 2026 is 5.94% vs 10.88% in Mar 2025
YoY Growth in year ended Mar 2026 is 47.58% vs 33.94% in Mar 2025
About Motisons Jewellers Ltd

Company Coordinates


