
Compare Motisons Jewel with Similar Stocks
Stock DNA
Gems, Jewellery And Watches
INR 1,647 Cr (Small Cap)
25.00
48
0.00%
0.05
12.81%
3.20
Total Returns (Price + Dividend) 
Motisons Jewel for the last several years.
Risk Adjusted Returns v/s
Returns Beta

News
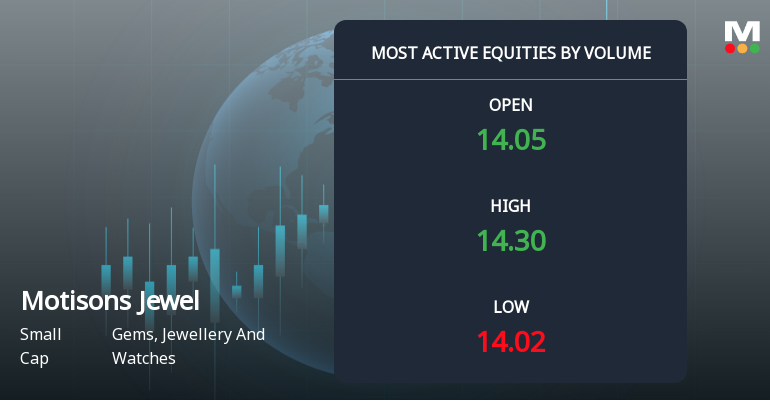
Motisons Jewellers Ltd Sees Exceptional Volume Amid Mixed Price Signals
Motisons Jewellers Ltd, a small-cap player in the Gems, Jewellery and Watches sector, witnessed one of the highest trading volumes on 25 June 2026, with nearly 97.15 lakh shares changing hands. Despite this surge in activity, the stock closed marginally lower, reflecting a complex interplay of investor sentiment and technical factors.
Read full news article
Motisons Jewellers Ltd Sees Exceptional Volume Surge Amid Mixed Technical Signals
Motisons Jewellers Ltd (MOTISONS), a small-cap player in the Gems, Jewellery and Watches sector, witnessed one of the highest trading volumes on 23 June 2026, with over 1.53 crore shares exchanging hands. Despite a modest price gain of 1.41%, the stock’s volume surge and technical indicators suggest a complex interplay of accumulation and distribution, warranting close attention from investors and market participants.
Read full news article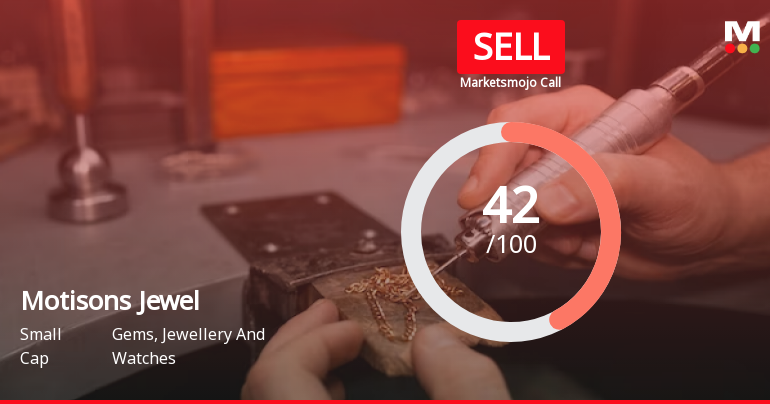
Motisons Jewellers Ltd is Rated Sell
Motisons Jewellers Ltd is rated 'Sell' by MarketsMOJO, with this rating last updated on 22 May 2026. However, the analysis and financial metrics discussed here reflect the stock's current position as of 22 June 2026, providing investors with the most up-to-date view of the company’s fundamentals, returns, and technical outlook.
Read full news article Announcements
Announcement under Regulation 30 (LODR)-Allotment
11-Jun-2026 | Source : BSEDisclosure of the details of allotment in the Issue (as defined hereinafter) by Motisons Jewellers Limited (the Company) in accordance with the Securities and Exchange Board of India (Listing Obligations and Disclosures Requirements) 2015 as amended (the SEBI Listing Regulations) as attached.
Board Meeting Outcome for Outcome Of Meeting Of Board Of Directors Held On June 11 2026.
11-Jun-2026 | Source : BSEOutcome of Meeting of Board of Directors held on June 11 2026 as attached
Board Meeting Outcome for Outcome Of The Meeting Of Board Of Directors Held On 9Th June 2026
09-Jun-2026 | Source : BSEOutcome of the meeting of Board of Directors held on 9th June 2026 as attached.
Corporate Actions

No Upcoming Board Meetings

No Dividend history available

Motisons Jewellers Ltd has announced 1:10 stock split, ex-date: 08 Nov 24

No Bonus history available

No Rights history available
Quality key factors
Valuation key factors
Technicals key factors
 Technical Indicator Scale: Bearish, Mildly Bearish, Sideways, Mildly Bullish, Bullish Turned
 Shareholding Snapshot : Mar 2026
Shareholding Compare (%holding)
Promoters
None
Held by 0 Schemes
Held by 8 FIIs (2.02%)
Motisons Global Private Limited (18.25%)
Umesh Parasmal Pagariya (1.4%)
26.5%
Quarterly Results Snapshot (Standalone) - Mar'26 - QoQ

QoQ Growth in quarter ended Mar 2026 is -21.25% vs 92.95% in Dec 2025
QoQ Growth in quarter ended Mar 2026 is -68.00% vs 21.05% in Dec 2025
Half Yearly Results Snapshot (Standalone) - Sep'25
Growth in half year ended Sep 2025 is -10.37% vs 11.98% in Sep 2024

Growth in half year ended Sep 2025 is 76.09% vs 56.94% in Sep 2024
Nine Monthly Results Snapshot (Standalone) - Dec'25
YoY Growth in nine months ended Dec 2025 is 2.54% vs 14.42% in Dec 2024
YoY Growth in nine months ended Dec 2025 is 72.96% vs 49.39% in Dec 2024
Annual Results Snapshot (Standalone) - Mar'26
YoY Growth in year ended Mar 2026 is 5.94% vs 10.88% in Mar 2025
YoY Growth in year ended Mar 2026 is 47.58% vs 33.94% in Mar 2025
About Motisons Jewellers Ltd

Company Coordinates


