
Compare Mrs Bectors with Similar Stocks
Total Returns (Price + Dividend) 
Latest dividend: 0.5985188509874326 per share ex-dividend date: Feb-17-2026
Risk Adjusted Returns v/s
Returns Beta

News
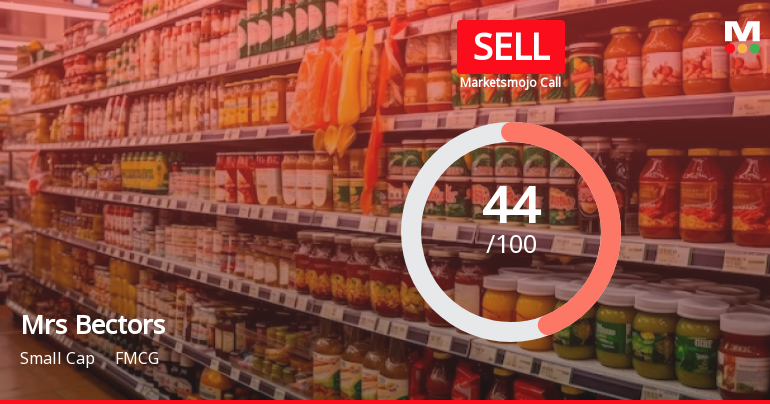
Mrs Bectors Food Specialities Ltd is Rated Sell
Mrs Bectors Food Specialities Ltd is rated 'Sell' by MarketsMOJO, with this rating last updated on 01 July 2026. However, the analysis and financial metrics discussed here reflect the stock’s current position as of 13 July 2026, providing investors with an up-to-date perspective on the company’s fundamentals, valuation, financial trend, and technical outlook.
Read full news article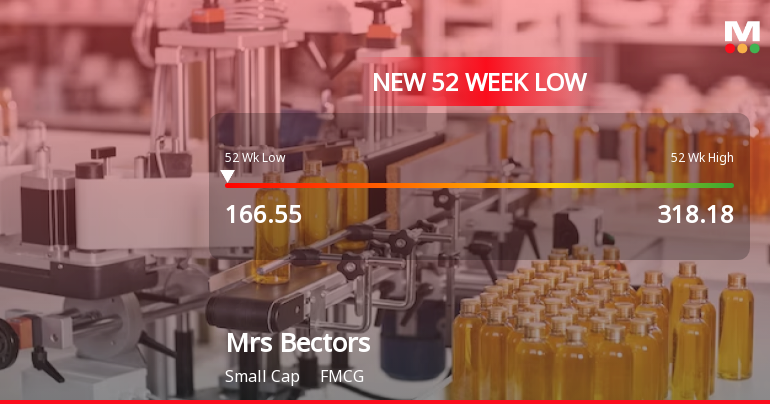
Mrs Bectors Food Specialities Ltd Falls to 52-Week Low of Rs 166.55 as Sell-Off Deepens
For the second consecutive session, Mrs Bectors Food Specialities Ltd has seen its share price decline, culminating in a fresh 52-week low of Rs 166.55 on 8 Jul 2026. This drop extends the stock’s downward trajectory, which has now erased over 41% of its value in the past year, significantly underperforming the broader Sensex index.
Read full news article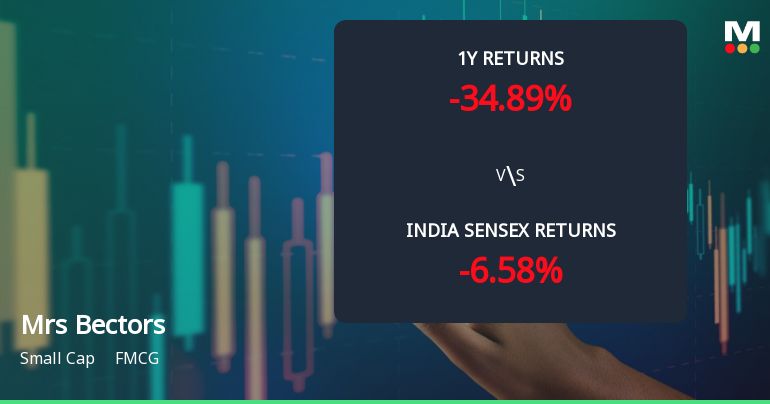
Mrs Bectors Food Specialities Ltd Faces Bearish Momentum Amid Technical Downgrade
Mrs Bectors Food Specialities Ltd has experienced a notable shift in its technical momentum, with key indicators signalling a transition from mildly bearish to bearish trends. The stock’s recent downgrade from a Hold to a Sell rating by MarketsMOJO, coupled with weakening moving averages and bearish Bollinger Bands, underscores growing investor caution in this small-cap FMCG player.
Read full news article Announcements
Corporate Actions

No Upcoming Board Meetings

Mrs Bectors Food Specialities Ltd has declared 30% dividend, ex-date: 17 Feb 26

Mrs Bectors Food Specialities Ltd has announced 2:10 stock split, ex-date: 12 Dec 25

No Bonus history available

No Rights history available
Quality key factors
Valuation key factors
Technicals key factors
 Technical Indicator Scale: Bearish, Mildly Bearish, Sideways, Mildly Bullish, Bullish Turned
 Shareholding Snapshot : Mar 2026
Shareholding Compare (%holding)
Promoters
None
Held by 20 Schemes (22.98%)
Held by 102 FIIs (10.4%)
Anoop Bector (20.46%)
Canara Robeco Mutual Fund A/c Canara Robeco Small Cap Fund (4.26%)
13.22%
Quarterly Results Snapshot (Consolidated) - Mar'26 - QoQ

QoQ Growth in quarter ended Mar 2026 is -8.90% vs -3.28% in Dec 2025
QoQ Growth in quarter ended Mar 2026 is -7.04% vs 4.33% in Dec 2025
Half Yearly Results Snapshot (Consolidated) - Sep'25
Growth in half year ended Sep 2025 is 9.48% vs 18.64% in Sep 2024
Growth in half year ended Sep 2025 is -9.37% vs 3.09% in Sep 2024
Nine Monthly Results Snapshot (Consolidated) - Dec'25
YoY Growth in nine months ended Dec 2025 is 9.10% vs 17.27% in Dec 2024
YoY Growth in nine months ended Dec 2025 is -3.18% vs 2.07% in Dec 2024
Annual Results Snapshot (Consolidated) - Mar'26
YoY Growth in year ended Mar 2026 is 9.06% vs 15.39% in Mar 2025
YoY Growth in year ended Mar 2026 is -1.64% vs 2.04% in Mar 2025
About Mrs Bectors Food Specialities Ltd

Company Coordinates


