MSP Steel & Pow.

  • Market Cap: Small Cap
  • Industry: Iron & Steel Products
  • ISIN: INE752G01015
  • NSEID: MSPL
  • BSEID: 532650
INR
35.34
-0.8 (-2.21%)
BSENSE

Sep 03, 03:30 PM

BSE+NSE Vol: 11.26 lacs

  • Price Points
  • Score
  • Mojo Parameters
  • Total Return
  • News and Corporate Actions
  • Key factors
  • Shareholding
  • Financials
  • CompanyCV
stock-summaryPrice Point
High/Low

1Day

52 Week

Valuation
Technical
Day's Volume

CASH

11.26 lacs (-3.71%) Volume

Shareholding (Jun 2026)

FII

1.18%

Held by 11 FIIs

DII

15.78%

Held by 10 DIIs

Promoter

45.12%

Why is MSP Steel & Power Ltd falling/rising?

03-Sep-2026

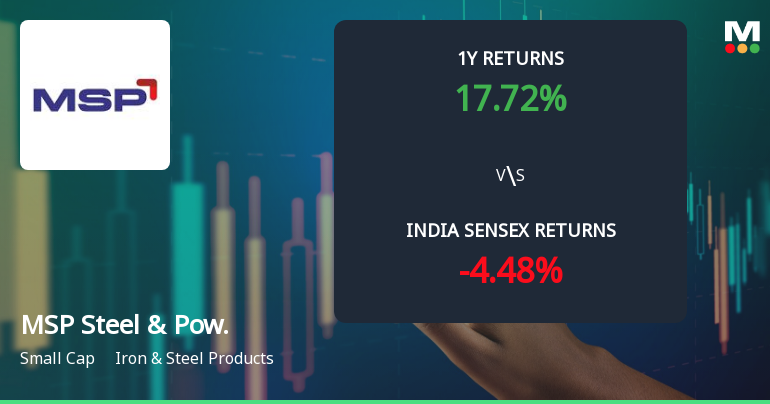
As of 02-Sep, MSP Steel & Power Ltd's stock price is rising to Rs 36.07, up 4.61%, driven by strong financial performance, increased investor interest, and a trend reversal after previous declines. The stock has outperformed its sector and is trading at a discount compared to peers, indicating potential for further investment.

As of 02-Sep, MSP Steel & Power Ltd's stock price is rising, currently at Rs 36.07, reflecting a change of 1.59 (4.61%) upward. This increase can be attributed to several factors. Firstly, the stock has outperformed its sector by 5.01% today, indicating strong relative performance. Additionally, it has experienced a trend reversal, gaining after two consecutive days of decline, which may signal renewed investor confidence.<BR><BR>The stock also reached an intraday high of Rs 36.4, marking a 5.57% increase during the day. Investor participation has risen, with a delivery volume of 6.97 lacs on September 1, which is a 21.65% increase compared to the 5-day average. This uptick in trading activity suggests growing interest among investors.<BR><BR>Financially, the company has reported positive results for the last three consecutive quarters, with a Return on Capital Employed (ROCE) of 9.29%, which is the highest recorded. The company’s profits have surged by 905.6% over the past year, contributing to a return of 17.72%, significantly outperforming the broader market, which has seen a return of only 1.82% in the same period. Furthermore, the stock is trading at a discount compared to its peers' historical valuations, which may attract more investors.<BR><BR>In summary, the combination of positive financial performance, increased trading activity, and favorable market conditions has contributed to the rise in MSP Steel & Power Ltd's stock price.

View full answer

Who are in the management team of MSP Steel & Pow.?

01-Sep-2026

The management team of MSP Steel & Power includes Suresh Kumar Agarwal (Chairman), Saket Agrawal (Managing Director), and several independent and non-independent directors, totaling nine members.

The management team of MSP Steel & Power includes the following individuals:<BR><BR>1. **Suresh Kumar Agarwal** - Chairman (Non-Executive) & Director (Non-Independent)<BR>2. **Saket Agrawal** - Executive Director & Managing Director<BR>3. **Manish Agrawal** - Non-Executive & Non-Independent Director<BR>4. **Navneet Jagatramka** - Independent Non-Executive Director<BR>5. **Ashok Soin** - Independent Non-Executive Director<BR>6. **Suneeta Mohanty** - Independent Non-Executive Director<BR>7. **Kapil Deo Pandey** - Independent Non-Executive Director<BR>8. **Prateek Bansal** - Independent Non-Executive Director<BR>9. **Puranmal Agrawal** - Non-Executive & Non-Independent Director<BR><BR>This team comprises a mix of executive and non-executive directors, with a focus on both independent and non-independent roles.

View full answer

What does MSP Steel & Pow. do?

01-Sep-2026

MSP Steel & Power Ltd, based in Kolkata, manufactures iron and steel products and generates power, reporting net sales of ₹827 Cr and a net profit of ₹22 Cr for June 2026. The company has a market cap of ₹2,064 Cr and key metrics include a P/E of 14.00 and a debt-equity ratio of 0.28.

Overview: <BR>MSP Steel & Power Ltd is a Kolkata-based manufacturer in the iron and steel products industry, categorized as a small-cap company.<BR><BR>History: <BR>The company is part of the MSP Group and is involved in the production of iron and steel as well as power generation. The latest quarterly results reported net sales and profit for June 2026.<BR><BR>Financial Snapshot: <BR>- Net Sales: 827 Cr (Quarterly Results - Jun 2026) <BR>- Net Profit: 22 Cr (Quarterly Results - Jun 2026) <BR>- Market Cap: INR 2,064 Cr (Small Cap) <BR><BR>Key Metrics: <BR>- P/E: 14.00 <BR>- Industry P/E: 25 <BR>- Dividend Yield: 0.00% <BR>- Debt Equity: 0.28 <BR>- Return on Equity: 13.12% <BR>- Price to Book: 2.01 <BR><BR>Contact Details: <BR>Address: 16/s Block-A New Alipore, Kolkata, West Bengal: 700053 <BR>Email: contactus@mspsteel.com <BR>Website: http://www.mspsteel.com

View full answer

Who are the peers of the MSP Steel & Pow.?

01-Sep-2026

MSP Steel & Pow.'s peers include JTL Industries, Venus Pipes, Ratnaveer Precis, Mahamaya Steel, Hi-Tech Pipes, Aeroflex Enter., Rhetan TMT Ltd, and Steel Exchange. In terms of management risk, growth, and capital structure, MSP Steel & Pow. ranks below average compared to its peers.

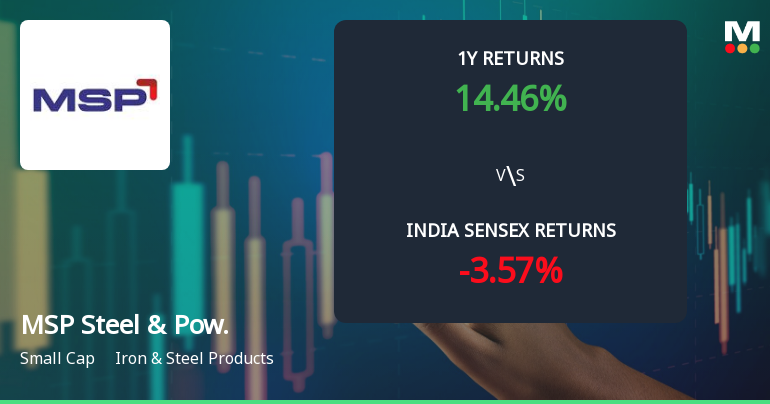
Peers: The peers of MSP Steel & Pow. are JTL Industries, Venus Pipes, Ratnaveer Precis, Mahamaya Steel, Hi-Tech Pipes, Aeroflex Enter., Rhetan TMT Ltd, and Steel Exchange.<BR><BR>Quality Snapshot: Excellent management risk is observed at Aeroflex Enter., while Good management risk is found at Venus Pipes and Hi-Tech Pipes. Average management risk is present at JTL Industries and Ratnaveer Precis, and the rest have Below Average management risk, including MSP Steel & Pow., Mahamaya Steel, Rhetan TMT Ltd, and Steel Exchange. Growth is Excellent at Venus Pipes, Good at Ratnaveer Precis and Aeroflex Enter., Average at JTL Industries and Hi-Tech Pipes, and the rest have Below Average growth, including MSP Steel & Pow. and Mahamaya Steel. Capital Structure is Excellent at Aeroflex Enter., Good at Venus Pipes, Average at JTL Industries, Ratnaveer Precis, Mahamaya Steel, and Hi-Tech Pipes, while Below Average is noted for MSP Steel & Pow., Rhetan TMT Ltd, and Steel Exchange.<BR><BR>Return Snapshot: Ratnaveer Precis has the highest 1-year return at 117.23%, while Hi-Tech Pipes has the lowest at -8.28%. MSP Steel & Pow.'s 1-year return of 14.46% is higher than Hi-Tech Pipes but lower than Ratnaveer Precis. Additionally, Hi-Tech Pipes, Rhetan TMT Ltd, and Steel Exchange all have negative six-month returns.

View full answer

How big is MSP Steel & Pow.?

01-Sep-2026

As of 31st August, MSP Steel & Power Ltd has a market capitalization of 2,064.00 Cr, with recent net sales of 2,958.62 Cr and a net profit of 37.91 Cr. The latest balance sheet shows shareholder's funds of 979.02 Cr and total assets of 1,534.93 Cr.

As of 31st August, MSP Steel & Power Ltd has a market capitalization of 2,064.00 Cr, categorizing it as a Small Cap company.<BR><BR>In the latest four quarters, the company reported Net Sales of 2,958.62 Cr and a Net Profit of 37.91 Cr.<BR><BR>The latest annual reporting period for the balance sheet is March 2025, showing Shareholder's Funds of 979.02 Cr and Total Assets of 1,534.93 Cr.

View full answer

Should I buy, sell or hold MSP Steel & Power Ltd?

04-Aug-2026

When is the next results date for MSP Steel & Power Ltd?

29-Jul-2026

The next results date for MSP Steel & Power Ltd is July 31, 2026.

The next results date for MSP Steel & Power Ltd is scheduled for July 31, 2026.

View full answer

Are MSP Steel & Power Ltd latest results good or bad?

01-Jun-2026

MSP Steel & Power Ltd's latest results show a significant profit increase of 1,451.91% and revenue growth of 27.77%, but these figures are boosted by a one-time tax credit, raising concerns about sustainability. Additionally, high promoter pledging poses risks for minority shareholders, suggesting caution for investors despite the strong headline numbers.

The latest results for MSP Steel & Power Ltd show a significant improvement, particularly in Q4 FY26. The company reported a net profit of ₹85.20 crores, which is an astonishing increase of 1,451.91% quarter-on-quarter. Revenue also rose by 27.77% to ₹816.32 crores, marking the highest quarterly figure in recent history.<BR><BR>Operating margins improved to 9.49%, the best in eight quarters, indicating enhanced operational efficiency. Additionally, the profit after tax margin surged to 10.44%, up from just 0.86% in the previous quarter.<BR><BR>However, it's important to note that this profit increase was significantly bolstered by an unusual tax credit of ₹37.19 crores, which raises questions about the sustainability of these results. Without such one-off gains, the underlying operational performance remains less impressive.<BR><BR>While the headline numbers appear strong, the company still faces challenges, including high promoter pledging at 71.27% of total shares, which poses risks to minority shareholders. The overall financial health shows signs of improvement, but the volatility in earnings and the reliance on one-time benefits suggest caution for investors.<BR><BR>In summary, while the latest results are good on the surface, the underlying quality and sustainability of these earnings are areas of concern.

View full answer

Is MSP Steel & Pow. overvalued or undervalued?

03-Dec-2025

As of December 2, 2025, MSP Steel & Power is considered overvalued with a PE ratio of 115.46 and an EV to EBITDA of 17.98, significantly higher than industry peers like JSW Steel and Tata Steel, and has underperformed with a year-to-date return of -17.21% compared to the Sensex's gain of 8.96%.

As of 2 December 2025, MSP Steel & Power has moved from a fair to an expensive valuation grade. The company is currently overvalued based on its financial metrics. Key ratios include a PE ratio of 115.46, an EV to EBITDA of 17.98, and a PEG ratio of 32.87, all of which are significantly higher than industry peers. For comparison, JSW Steel has a PE ratio of 46.39 and an EV to EBITDA of 13.75, while Tata Steel shows a PE of 28.13 and an EV to EBITDA of 10.3, indicating that MSP Steel & Power is trading at a premium relative to these competitors.<BR><BR>Additionally, MSP Steel & Power's recent stock performance has been mixed, with a year-to-date return of -17.21%, contrasting sharply with the Sensex's gain of 8.96% over the same period. This underperformance, combined with its high valuation ratios, reinforces the conclusion that the company is overvalued in the current market environment.

View full answer

How has been the historical performance of MSP Steel & Pow.?

17-Nov-2025

MSP Steel & Pow. has shown steady revenue growth from INR 1,532.73 crore in March 2020 to INR 2,905.25 crore in March 2025, but has struggled with profitability, reporting a loss of INR 28.41 crore in March 2025. While total liabilities and assets decreased, cash flow from operations improved, indicating ongoing financial challenges.

Answer:<BR>The historical performance of MSP Steel & Pow. shows a fluctuating trend in key financial metrics over the years.<BR><BR>Breakdown:<BR>MSP Steel & Pow. has experienced growth in net sales from INR 1,532.73 crore in March 2020 to INR 2,905.25 crore in March 2025, indicating a steady increase in revenue. However, the company has faced challenges with profitability, as evidenced by its profit after tax, which has been negative in several years, including a loss of INR 28.41 crore in March 2025, following a profit of INR 14.34 crore in March 2024. The operating profit margin has also varied, peaking at 8.26% in March 2021 but dropping to 4.61% in March 2025. Total liabilities decreased from INR 1,703.33 crore in March 2020 to INR 1,534.93 crore in March 2025, while total assets followed a similar trend, declining from INR 1,703.33 crore to INR 1,534.93 crore over the same period. Cash flow from operating activities improved to INR 189 crore in March 2025 from INR 77 crore in March 2020, although the net cash flow showed an outflow of INR 22 crore in March 2025. Overall, while MSP Steel & Pow. has seen growth in sales, it continues to grapple with profitability and cash flow challenges.

View full answer

Is MSP Steel & Pow. technically bullish or bearish?

13-Nov-2025

As of November 12, 2025, the trend is mildly bullish, supported by daily moving averages and monthly RSI, though caution is advised due to mildly bearish weekly MACD and KST, while long-term performance remains strong despite recent underperformance against the Sensex.

As of 12 November 2025, the technical trend has changed from sideways to mildly bullish. The current stance is mildly bullish, driven by daily moving averages indicating mild bullishness and monthly RSI showing bullish momentum. However, the weekly MACD and KST are both mildly bearish, which suggests some caution. The Bollinger Bands are bullish on both weekly and monthly time frames, supporting the overall positive outlook. Despite recent underperformance compared to the Sensex over the past month and year, the long-term performance over 3, 5, and 10 years remains strong.

View full answer

Who are the top shareholders of the MSP Steel & Pow.?

17-Jul-2025

The top shareholders of MSP Steel & Power include Jagran Vyapaar Pvt. Ltd. with 6.9%, Tarini Mata Properties Pvt. Ltd. with 9.47%, and individual investors holding 13.75%. Notably, 81.33% of promoter holdings are pledged, and foreign institutional investors hold a small stake of 0.4%.

The top shareholders of MSP Steel & Power include a mix of institutional and individual investors. The majority of the shareholding is held by non-institutional entities, with a significant portion of promoter holdings being pledged at 81.33%. <BR><BR>The promoter with the highest holding is Jagran Vyapaar Pvt. Ltd., which holds 6.9% of the shares. The highest public shareholder is Tarini Mata Properties Pvt. Ltd., owning 9.47%. Additionally, individual investors collectively hold 13.75% of the shares, while foreign institutional investors (FIIs) hold a small stake of 0.4% through 8 different FIIs. <BR><BR>This distribution indicates a diverse ownership structure, with a notable concentration of shares among a few key players.

View full answer

Has MSP Steel & Pow. declared dividend?

06-Jun-2025

MSP Steel & Power Ltd has declared a 2% dividend, amounting to 0.2 per share, with an ex-date of September 14, 2012. However, the current dividend yield is 0%, and total returns have varied significantly over different periods, showing strong price appreciation in the long term.

MSP Steel & Power Ltd has declared a 2% dividend.<BR><BR>Dividend Details:<BR>- Percentage announced: 2%<BR>- Amount per share: 0.2<BR>- Ex-date: 14 Sep 12<BR><BR>Dividend Yield: 0%<BR><BR>Total Returns by Period:<BR>In the 6-month period, the price return was -42.53%, the dividend return was 0%, resulting in a total return of -42.53%.<BR><BR>For the 1-year period, the price return was 9.61%, the dividend return was 0%, leading to a total return of 9.61%.<BR><BR>Over the 2-year period, the price return was 208.0%, with a dividend return of 0%, culminating in a total return of 208.0%.<BR><BR>In the 3-year period, the price return was 136.9%, the dividend return was 0%, resulting in a total return of 136.9%.<BR><BR>For the 4-year period, the price return was 146.11%, with a dividend return of 0%, leading to a total return of 146.11%.<BR><BR>In the 5-year period, the price return was 515.28%, the dividend return was 0%, resulting in a total return of 515.28%.<BR><BR>Overall, while MSP Steel & Power Ltd declared a dividend in the past, the current dividend yield stands at 0%. The total returns over various periods show significant price appreciation, particularly over longer durations, despite the absence of recent dividends.

View full answer
iScoreScore
Click here to find our call on this stock
Strong Sell
Sell
Hold
Buy
Strong Buy

Dashboard

1

Weak Long Term Fundamental Strength with an average Return on Capital Employed (ROCE) of 5.86%

  • Poor long term growth as Net Sales has grown by an annual rate of 8.06% and Operating profit at 2.30% over the last 5 years
  • Low ability to service debt as the company has a high Debt to EBITDA ratio of 1.81 times
2

63.53% of Promoter Shares are Pledged

stock-summaryMojo Parameters

Mojo Parameters

Loading Valuation Snapshot...

Stock DNA

stock-summary
Industry

Iron & Steel Products

stock-summary
Market cap

INR 2,099 Cr (Small Cap)

stock-summary
P/E

14.00

stock-summary
Industry P/E

25

stock-summary
Dividend Yield

0.00%

stock-summary
Debt Equity

0.28

stock-summary
Return on Equity

13.12%

stock-summary
Price to Book

1.99

Revenue and Profits:
Net Sales:
827 Cr
(Quarterly Results - Jun 2026)
Net Profit:
22 Cr
stock-summaryTotal Returns
Total Returns (Price + Dividend) stock-summary
Dividend Yield (0%)
TimePeriod
Price Return
Dividend Return
Total Return
3 Months
-14.12%
0%
-14.12%
6 Months
12.87%
0%
12.87%
1 Year
10.54%
0%
10.54%
2 Years
-13.17%
0%
-13.17%
3 Years
194.5%
0%
194.5%
4 Years
272.0%
0%
272.0%
5 Years
255.18%
0%
255.18%

Latest dividend: 0.2 per share ex-dividend date: Sep-14-2012

Risk Adjusted Returns v/s stock-summary
Returns Beta
Icon
Beta has not been calculated since enough price history is not available
stock-summaryNews & Corporate Actions

News

Announcements stock-summary

MSP Steel & Power Limited - Clarification

26-Nov-2019 | Source : NSE

MSP Steel & Power Limited with respect to announcement dated 14-Nov-2019, regarding Board meeting held on November 14, 2019. On basis of above the Company is required to clarify following: 1. Whether the acquisition would fall within related party transactions and whether the promoter/ promoter group/ group companies have any interest in the entity being acquired? If yes, nature of interest and details thereof and whether the same is done at "arm's length";

MSP Steel & Power Limited - Outcome of Board Meeting

15-Nov-2019 | Source : NSE

MSP Steel & Power Limited has informed the Exchange regarding Board meeting held on November 14, 2019.

MSP Steel & Power Limited - Trading Window

09-Oct-2019 | Source : NSE

MSP Steel & Power Limited has informed the Exchange regarding the Trading Window closure pursuant to SEBI (Prohibition of Insider Trading) Regulations, 2015 as amended by SEBI (Prohibition of Insider Trading) (Amendment) Regulation, 2018

Corporate Actions stock-summary

stock-summary
BOARD MEETING

No Upcoming Board Meetings

stock-summary
DIVIDEND

MSP Steel & Power Ltd has declared 2% dividend, ex-date: 14 Sep 12

stock-summary
SPLITS

No Splits history available

stock-summary
BONUS

No Bonus history available

stock-summary
RIGHTS

No Rights history available

stock-summaryKey Factors

Quality key factors stock-summary

Factor
Value
Sales Growth (5y)
8.06%
EBIT Growth (5y)
2.30%
EBIT to Interest (avg)
1.21
Debt to EBITDA (avg)
6.04
Net Debt to Equity (avg)
0.28
Sales to Capital Employed (avg)
2.00
Tax Ratio
100.00%
Dividend Payout Ratio
0
Pledged Shares
63.53%
Institutional Holding
16.96%
ROCE (avg)
5.79%
ROE (avg)
3.95%

Valuation key factors

Factor
Value
P/E Ratio
14
Industry P/E
25
Price to Book Value
1.95
EV to EBIT
17.78
EV to EBITDA
12.42
EV to Capital Employed
1.74
EV to Sales
0.78
PEG Ratio
0.02
Dividend Yield
NA
ROCE (Latest)
9.26%
ROE (Latest)
13.12%

Technicals key factors

Indicator
Weekly
Monthly
MACD
Bearish
Mildly Bearish
RSI
No Signal
No Signal
Bollinger Bands
Bearish
Mildly Bullish
Moving Averages
Mildly Bullish (Daily)
KST
Bearish
Mildly Bearish
Dow Theory
Mildly Bullish
No Trend
OBV
No Trend
No Trend
stock-summary Technical Indicator Scale: Bearish, Mildly Bearish, Sideways, Mildly Bullish, Bullish  Turned 
stock-summaryShareholding
Shareholding Snapshot : Jun 2026stock-summary
Shareholding Compare (%holding) stock-summary
Majority shareholders

Promoters

Pledged Promoter Holdings

63.5267

Mutual Funds

Held by 0 Schemes

FIIs

Held by 11 FIIs (1.18%)

Promoter with highest holding

Jagran Vyapaar Pvt. Ltd. (7.98%)

Highest Public shareholder

Tarini Mata Properties Private Limited (9.47%)

Individual Investors Holdings

14.06%

stock-summaryFinancial
[
  {
    "link": "quarterly",
    "btn_text": "All Quarterly Results",
    "header": "Quarterly Results Snapshot (Consolidated) - Jun'26 - QoQ",
    "rhs": [
      {
        "prefix": "Net Sales ",
        "suffix": "QoQ Growth in quarter ended Jun 2026 is 1.25% vs 27.77% in Mar 2026",
        "dir": -1
      },
      {
        "prefix": "Consolidated Net Profit ",
        "suffix": "QoQ Growth in quarter ended Jun 2026 is -74.20% vs 1,451.91% in Mar 2026",
        "dir": -1
      }
    ],
    "table": {
      "header": [
        "Jun'26",
        "Mar'26",
        "Change(%)"
      ],
      "body": [
        {
          "field": "Net Sales",
          "val1": "826.52",
          "val2": "816.32",
          "chgp": "1.25%",
          "chgp_class": "positive"
        },
        {
          "field": "Operating Profit (PBDIT) excl Other Income",
          "val1": "52.56",
          "val2": "77.46",
          "chgp": "-32.15%",
          "chgp_class": "negative"
        },
        {
          "field": "Interest",
          "val1": "10.95",
          "val2": "16.75",
          "chgp": "-34.63%",
          "chgp_class": "positive"
        },
        {
          "field": "Exceptional Items",
          "val1": "0.00",
          "val2": "0.00",
          "chgp": "",
          "chgp_class": "neutral"
        },
        {
          "field": "Consolidate Net Profit",
          "val1": "21.98",
          "val2": "85.20",
          "chgp": "-74.20%",
          "chgp_class": "negative"
        },
        {
          "field": "Operating Profit Margin (Excl OI)",
          "val1": "6.36%",
          "val2": "9.49%",
          "chgp": "-3.13%",
          "chgp_class": "negative"
        }
      ]
    }
  },
  {
    "link": "half-yearly",
    "btn_text": "All Half Yearly Results",
    "header": "Half Yearly Results Snapshot (Consolidated) - Sep'25",
    "rhs": [
      {
        "prefix": "Net Sales ",
        "suffix": " Growth in half year ended Sep 2025 is -2.84% vs 6.20% in Sep 2024",
        "dir": -1
      },
      {
        "prefix": "Consolidated Net Profit ",
        "suffix": " Growth in half year ended Sep 2025 is -1,969.82% vs 20.29% in Sep 2024",
        "dir": -1
      }
    ],
    "table": {
      "header": [
        "Sep'25",
        "Sep'24",
        "Change(%)"
      ],
      "body": [
        {
          "field": "Net Sales",
          "val1": "1,387.73",
          "val2": "1,428.32",
          "chgp": "-2.84%",
          "chgp_class": "negative"
        },
        {
          "field": "Operating Profit (PBDIT) excl Other Income",
          "val1": "67.67",
          "val2": "69.95",
          "chgp": "-3.26%",
          "chgp_class": "negative"
        },
        {
          "field": "Interest",
          "val1": "20.05",
          "val2": "42.63",
          "chgp": "-52.97%",
          "chgp_class": "positive"
        },
        {
          "field": "Exceptional Items",
          "val1": "-100.88",
          "val2": "0.00",
          "chgp": "",
          "chgp_class": "neutral"
        },
        {
          "field": "Consolidate Net Profit",
          "val1": "-56.92",
          "val2": "-2.75",
          "chgp": "-1,969.82%",
          "chgp_class": "negative"
        },
        {
          "field": "Operating Profit Margin (Excl OI)",
          "val1": "4.88%",
          "val2": "4.90%",
          "chgp": "-0.02%",
          "chgp_class": "negative"
        }
      ]
    }
  },
  {
    "link": "nine-monthly",
    "btn_text": "All Nine Monthly Results",
    "header": "Nine Monthly Results Snapshot (Consolidated) - Dec'25",
    "rhs": [
      {
        "prefix": "Net Sales ",
        "suffix": "YoY Growth in nine months ended Dec 2025 is -5.52% vs 0.91% in Dec 2024",
        "dir": -1
      },
      {
        "prefix": "Consolidated Net Profit ",
        "suffix": "YoY Growth in nine months ended Dec 2025 is -1,040.22% vs 311.28% in Dec 2024",
        "dir": -1
      }
    ],
    "table": {
      "header": [
        "Dec'25",
        "Dec'24",
        "Change(%)"
      ],
      "body": [
        {
          "field": "Net Sales",
          "val1": "2,026.65",
          "val2": "2,145.17",
          "chgp": "-5.52%",
          "chgp_class": "negative"
        },
        {
          "field": "Operating Profit (PBDIT) excl Other Income",
          "val1": "100.19",
          "val2": "89.15",
          "chgp": "12.38%",
          "chgp_class": "positive"
        },
        {
          "field": "Interest",
          "val1": "30.87",
          "val2": "58.52",
          "chgp": "-47.25%",
          "chgp_class": "positive"
        },
        {
          "field": "Exceptional Items",
          "val1": "-101.63",
          "val2": "0.00",
          "chgp": "",
          "chgp_class": "neutral"
        },
        {
          "field": "Consolidate Net Profit",
          "val1": "-51.43",
          "val2": "5.47",
          "chgp": "-1,040.22%",
          "chgp_class": "negative"
        },
        {
          "field": "Operating Profit Margin (Excl OI)",
          "val1": "4.94%",
          "val2": "4.16%",
          "chgp": "0.78%",
          "chgp_class": "positive"
        }
      ]
    }
  },
  {
    "link": "annual",
    "btn_text": "All Annual Results",
    "header": "Annual Results Snapshot (Consolidated) - Mar'26",
    "rhs": [
      {
        "prefix": "Net Sales ",
        "suffix": "YoY Growth in year ended Mar 2026 is -2.14% vs 1.09% in Mar 2025",
        "dir": -1
      },
      {
        "prefix": "Consolidated Net Profit ",
        "suffix": "YoY Growth in year ended Mar 2026 is 219.12% vs -297.42% in Mar 2025",
        "dir": 1
      }
    ],
    "table": {
      "header": [
        "Mar'26",
        "Mar'25",
        "Change(%)"
      ],
      "body": [
        {
          "field": "Net Sales",
          "val1": "2,842.96",
          "val2": "2,905.25",
          "chgp": "-2.14%",
          "chgp_class": "negative"
        },
        {
          "field": "Operating Profit (PBDIT) excl Other Income",
          "val1": "177.64",
          "val2": "133.86",
          "chgp": "32.71%",
          "chgp_class": "positive"
        },
        {
          "field": "Interest",
          "val1": "47.62",
          "val2": "81.18",
          "chgp": "-41.34%",
          "chgp_class": "positive"
        },
        {
          "field": "Exceptional Items",
          "val1": "-101.63",
          "val2": "0.00",
          "chgp": "",
          "chgp_class": "neutral"
        },
        {
          "field": "Consolidate Net Profit",
          "val1": "33.77",
          "val2": "-28.35",
          "chgp": "219.12%",
          "chgp_class": "positive"
        },
        {
          "field": "Operating Profit Margin (Excl OI)",
          "val1": "6.25%",
          "val2": "4.61%",
          "chgp": "1.64%",
          "chgp_class": "positive"
        }
      ]
    }
  }
]

Quarterly Results Snapshot (Consolidated) - Jun'26 - QoQstock-summary

Jun'26
Mar'26
Change(%)
Net Sales
826.52
816.32
1.25%
Operating Profit (PBDIT) excl Other Income
52.56
77.46
-32.15%
Interest
10.95
16.75
-34.63%
Exceptional Items
0.00
0.00
Consolidate Net Profit
21.98
85.20
-74.20%
Operating Profit Margin (Excl OI)
6.36%
9.49%
-3.13%
Values in Rs Cr.
Direction Arrows
Net Sales

QoQ Growth in quarter ended Jun 2026 is 1.25% vs 27.77% in Mar 2026

Direction Arrows
Consolidated Net Profit

QoQ Growth in quarter ended Jun 2026 is -74.20% vs 1,451.91% in Mar 2026

Half Yearly Results Snapshot (Consolidated) - Sep'25stock-summary

Sep'25
Sep'24
Change(%)
Net Sales
1,387.73
1,428.32
-2.84%
Operating Profit (PBDIT) excl Other Income
67.67
69.95
-3.26%
Interest
20.05
42.63
-52.97%
Exceptional Items
-100.88
0.00
Consolidate Net Profit
-56.92
-2.75
-1,969.82%
Operating Profit Margin (Excl OI)
4.88%
4.90%
-0.02%
Values in Rs Cr.
Direction Arrows
Net Sales

Growth in half year ended Sep 2025 is -2.84% vs 6.20% in Sep 2024

Direction Arrows
Consolidated Net Profit

Growth in half year ended Sep 2025 is -1,969.82% vs 20.29% in Sep 2024

Nine Monthly Results Snapshot (Consolidated) - Dec'25stock-summary

Dec'25
Dec'24
Change(%)
Net Sales
2,026.65
2,145.17
-5.52%
Operating Profit (PBDIT) excl Other Income
100.19
89.15
12.38%
Interest
30.87
58.52
-47.25%
Exceptional Items
-101.63
0.00
Consolidate Net Profit
-51.43
5.47
-1,040.22%
Operating Profit Margin (Excl OI)
4.94%
4.16%
0.78%
Values in Rs Cr.
Direction Arrows
Net Sales

YoY Growth in nine months ended Dec 2025 is -5.52% vs 0.91% in Dec 2024

Direction Arrows
Consolidated Net Profit

YoY Growth in nine months ended Dec 2025 is -1,040.22% vs 311.28% in Dec 2024

Annual Results Snapshot (Consolidated) - Mar'26stock-summary

Mar'26
Mar'25
Change(%)
Net Sales
2,842.96
2,905.25
-2.14%
Operating Profit (PBDIT) excl Other Income
177.64
133.86
32.71%
Interest
47.62
81.18
-41.34%
Exceptional Items
-101.63
0.00
Consolidate Net Profit
33.77
-28.35
219.12%
Operating Profit Margin (Excl OI)
6.25%
4.61%
1.64%
Values in Rs Cr.
Direction Arrows
Net Sales

YoY Growth in year ended Mar 2026 is -2.14% vs 1.09% in Mar 2025

Direction Arrows
Consolidated Net Profit

YoY Growth in year ended Mar 2026 is 219.12% vs -297.42% in Mar 2025

stock-summaryCompany CV
About MSP Steel & Power Ltd stock-summary
stock-summary
MSP Steel & Power Ltd
Small Cap
Iron & Steel Products
MSP Steel & Power Limited, a part of the MSP Group, is a Kolkata-based steel manufacturer. The Company is into production of iron and steel and generation of power. The company has a diversified portfolio, including sponge iron, steel, power generation, rolling mills and ferro alloys. They market their TMT bars under the brand name of MSP Gold Theremax TMT. They are having their manufacturing plant at Raigarh in Chattisgarh.
Company Coordinates stock-summary
Company Details
16/s Block-A New Alipore , Kolkata West Bengal : 700053
stock-summary
Tel:
stock-summary
contactus@mspsteel.com
Registrar Details
Karvy Computershare Pvt Ltd, Karvy House , 46 Avenue 4, Street No 1, Banjara Hills, Hyderabad