
Compare M.V.K. Agro with Similar Stocks
Dashboard
Poor Management Efficiency with a low ROCE of 8.66%
- The company has been able to generate a Return on Capital Employed (avg) of 8.66% signifying low profitability per unit of total capital (equity and debt)
Low ability to service debt as the company has a high Debt to EBITDA ratio of 5.29 times
Flat results in Mar 26
With ROCE of 7.1, it has a Very Expensive valuation with a 3.3 Enterprise value to Capital Employed
Despite the size of the company, domestic mutual funds hold only 0% of the company
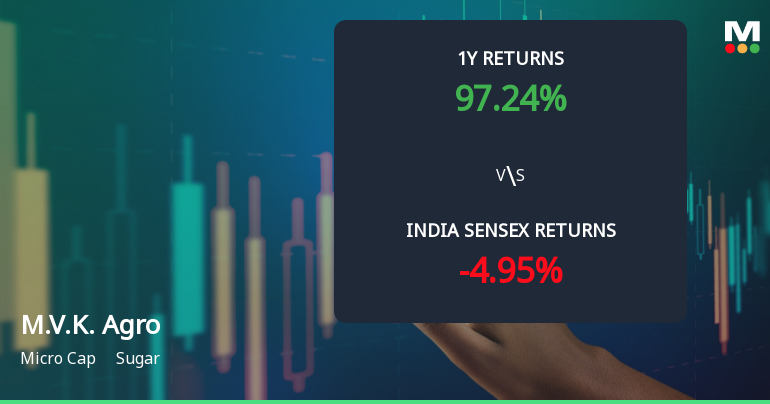
Total Returns (Price + Dividend) 
M.V.K. Agro for the last several years.
Risk Adjusted Returns v/s
Returns Beta

News
M.V.K. Agro Food Product Ltd Sees Technical Momentum Shift Amid Mixed Market Signals
M.V.K. Agro Food Product Ltd, a micro-cap player in the sugar sector, has experienced a nuanced shift in its technical momentum, moving from a strongly bearish stance to a mildly bearish trend. Despite a recent downgrade in its Mojo Grade to 'Sell' from 'Strong Sell', the stock’s price action and technical indicators reveal a complex interplay of bearish and bullish signals, warranting a closer examination for investors navigating this volatile terrain.
Read full news article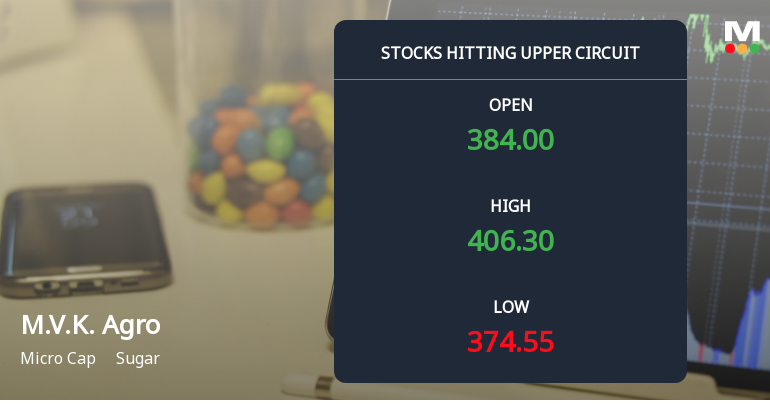
M.V.K. Agro Food Product Ltd Locks at Upper Circuit With 9.99% Gain — Buyers Queue, Sellers Absent
At Rs 406.3, the buying was done — not because demand dried up, but because the exchange wouldn't let the stock go any higher. M.V.K. Agro Food Product Ltd locked at its upper circuit of 9.99% on 15 Jul 2026, with buyers queuing and no sellers willing to part with shares.
Read full news article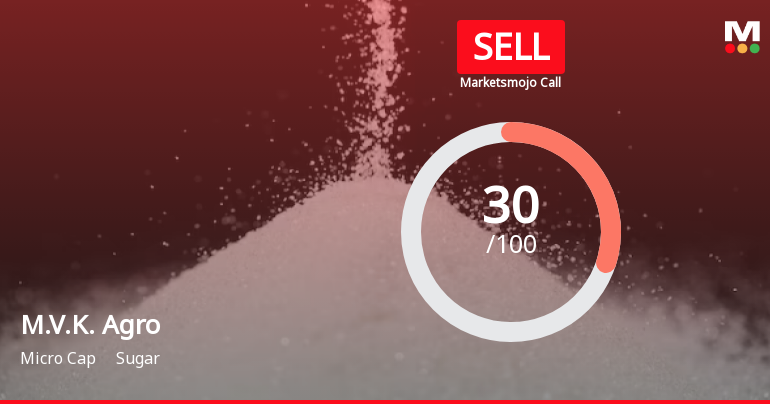
M.V.K. Agro Food Product Ltd is Rated Sell
M.V.K. Agro Food Product Ltd is rated 'Sell' by MarketsMOJO, with this rating last updated on 02 June 2026. However, the analysis and financial metrics discussed here reflect the stock's current position as of 16 July 2026, providing investors with the latest insights into the company’s performance and outlook.
Read full news article Announcements
Corporate Actions

No Upcoming Board Meetings

No Dividend history available

No Splits history available

No Bonus history available

No Rights history available
Quality key factors
Valuation key factors
Technicals key factors
 Technical Indicator Scale: Bearish, Mildly Bearish, Sideways, Mildly Bullish, Bullish Turned
 Shareholding Snapshot : Mar 2026
Shareholding Compare (%holding)
Promoters
None
Held by 0 Schemes
Held by 2 FIIs (0.04%)
Marotrao Vyankatrao Kawale (35.47%)
Kamya Abhishek Kamdar (3.89%)
37.88%
Quarterly Results Snapshot (Standalone) - Mar'26 - QoQ

QoQ Growth in quarter ended Mar 2026 is 59.41% vs 222.30% in Dec 2025
QoQ Growth in quarter ended Mar 2026 is 64.45% vs 162.12% in Dec 2025
Half Yearly Results Snapshot (Consolidated) - Sep'25
Growth in half year ended Sep 2025 is -44.78% vs 65.95% in Mar 2025
Growth in half year ended Sep 2025 is -21.42% vs 53.12% in Mar 2025
Nine Monthly Results Snapshot (Consolidated) - Dec'25
YoY Growth in nine months ended Dec 2025 is -14.02% vs -1.97% in Mar 2026
YoY Growth in nine months ended Dec 2025 is -57.33% vs -1.75% in Mar 2026
Annual Results Snapshot (Consolidated) - Mar'26

YoY Growth in year ended Mar 2026 is 113.64% vs 5.86% in Mar 2025
YoY Growth in year ended Mar 2026 is 399.79% vs 7.00% in Mar 2025
About M.V.K. Agro Food Product Ltd

Company Coordinates


