
Compare Nagpur Power with Similar Stocks
Dashboard
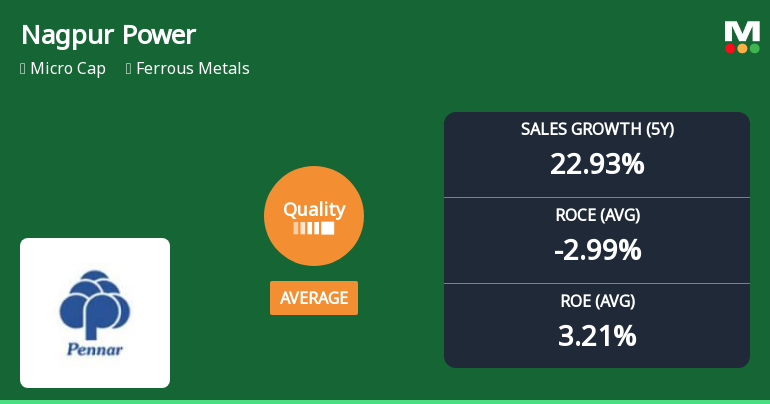
Poor Management Efficiency with a low ROE of 3.21%
- The company has been able to generate a Return on Equity (avg) of 3.21% signifying low profitability per unit of shareholders funds
Poor long term growth as Operating profit has grown by an annual rate 8.16% of over the last 5 years
Flat results in Mar 26
Risky - Negative Operating Profits
Stock DNA
Ferrous Metals
INR 192 Cr (Micro Cap)
NA (Loss Making)
12
0.00%
0.03
-2.57%
2.31
Total Returns (Price + Dividend) 
Nagpur Power for the last several years.
Risk Adjusted Returns v/s
Returns Beta

News
Nagpur Power & Industries Ltd: Quality Metrics Improve Amidst Mixed Financial Signals
Nagpur Power & Industries Ltd has witnessed an upgrade in its quality grade from below average to average, reflecting some improvement in its business fundamentals. Despite this positive shift, the company continues to face challenges in key financial metrics such as return on capital employed and debt servicing capacity, which investors should carefully consider amid a volatile market backdrop.
Read full news article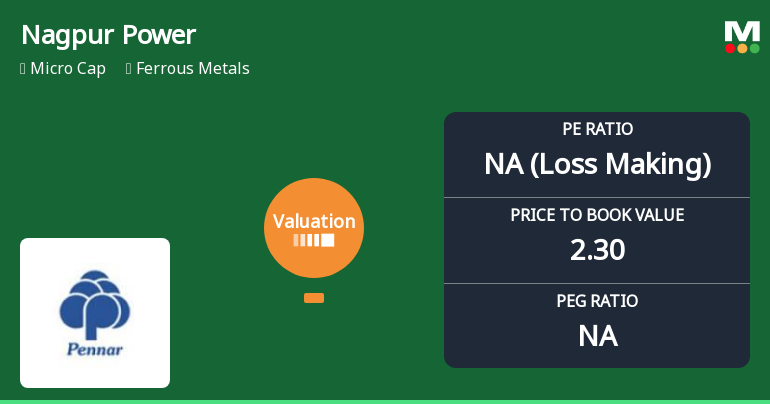
Valuation Shift Dims Price Attractiveness of Nagpur Power & Industries Ltd
Nagpur Power & Industries Ltd, a micro-cap player in the ferrous metals sector, has seen a marked deterioration in its valuation parameters, shifting from expensive to risky territory. This change, coupled with a recent downgrade in its Mojo Grade from Strong Sell to Sell, signals a challenging outlook for investors as key metrics such as price-to-earnings and enterprise value multiples diverge sharply from industry peers and historical norms.
Read full news article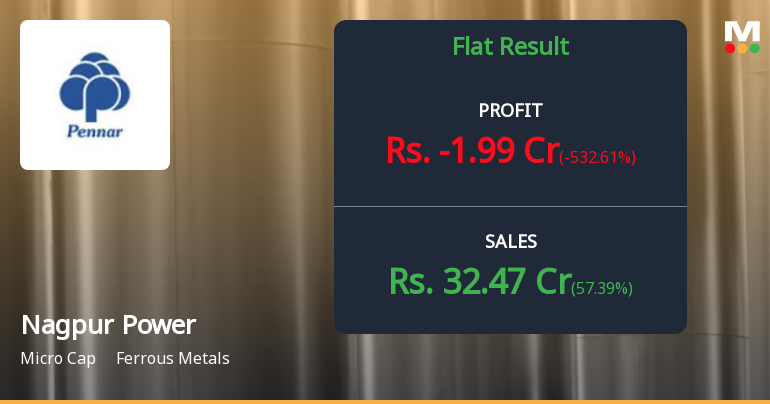
Nagpur Power Q4 FY26: Profit Turns to Loss as Operational Challenges Mount
Nagpur Power & Industries Ltd., a micro-cap ferrous metals company specialising in low ferro manganese production through slag recovery, reported a disappointing fourth quarter for FY26, swinging to a net loss of ₹1.99 crores from a profit of ₹0.46 crores in the previous quarter. The sharp deterioration in profitability, despite a 57.39% quarter-on-quarter revenue surge to ₹32.47 crores, has raised concerns about the company's operational efficiency and cost management capabilities. Trading at ₹149.85 with a market capitalisation of ₹202 crores, the stock has declined 3.10% following the results announcement.
Read full news article Announcements
Announcement under Regulation 30 (LODR)-Newspaper Publication
31-May-2026 | Source : BSENewspaper Publication of Audited (Standalone & Consolidated) Financial Results for the Quarter and Financial Year ended March 31 2026
Intimation Of Appointment Of Internal Auditors Of The Company For FY 2026-27
29-May-2026 | Source : BSEPlease find attached herewith intimation of appointment of M/s. M. V. Ghelani & Co. Chartered Accountants as Internal Auditors of the Company for F.Y. 2026-27.
Re-Appointment Of Whole Time Director Designated As Executive Chairman
29-May-2026 | Source : BSEThe Board has re-appointed Mr. Gautam Khandelwal as Whole Time Director designated as executive chairman for a period of 3 years commencing from 30th June 2026 subject to shareholders approval.
Corporate Actions

No Upcoming Board Meetings

No Dividend history available

No Splits history available

No Bonus history available

No Rights history available
Quality key factors
Valuation key factors
Technicals key factors
 Technical Indicator Scale: Bearish, Mildly Bearish, Sideways, Mildly Bullish, Bullish Turned
 Shareholding Snapshot : Mar 2026
Shareholding Compare (%holding)
Promoters
None
Held by 0 Schemes
Held by 0 FIIs
Zeppelin Investment Private Limited (43.08%)
Lici Asm Non Par (6.64%)
27.12%
Quarterly Results Snapshot (Consolidated) - Mar'26 - QoQ

QoQ Growth in quarter ended Mar 2026 is 57.39% vs 34.14% in Dec 2025

QoQ Growth in quarter ended Mar 2026 is -532.61% vs 146.46% in Dec 2025
Half Yearly Results Snapshot (Consolidated) - Sep'25
Growth in half year ended Sep 2025 is 2.34% vs 36.59% in Sep 2024
Growth in half year ended Sep 2025 is -117.49% vs 572.55% in Sep 2024
Nine Monthly Results Snapshot (Consolidated) - Dec'25
YoY Growth in nine months ended Dec 2025 is 15.37% vs 36.41% in Dec 2024
YoY Growth in nine months ended Dec 2025 is -117.28% vs -42.55% in Dec 2024
Annual Results Snapshot (Consolidated) - Mar'26
YoY Growth in year ended Mar 2026 is 35.28% vs 33.43% in Mar 2025
YoY Growth in year ended Mar 2026 is -177.82% vs 536.51% in Mar 2025
About Nagpur Power & Industries Ltd

Company Coordinates


