
Compare Scan Steels with Similar Stocks
Dashboard
Weak Long Term Fundamental Strength with a -7.84% CAGR growth in Operating Profits over the last 5 years
- The company has been able to generate a Return on Equity (avg) of 5.01% signifying low profitability per unit of shareholders funds
Positive results in Jun 26
With ROCE of 6.5, it has a Attractive valuation with a 0.8 Enterprise value to Capital Employed
Majority shareholders : Promoters
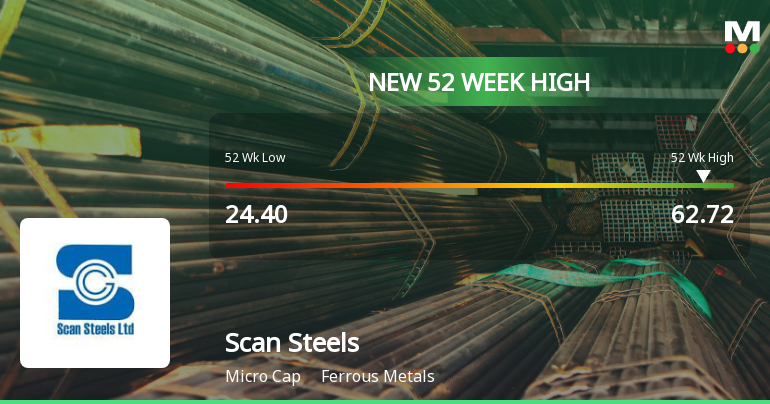
Market Beating performance in long term as well as near term
Total Returns (Price + Dividend) 
Scan Steels for the last several years.
Risk Adjusted Returns v/s
Returns Beta

News
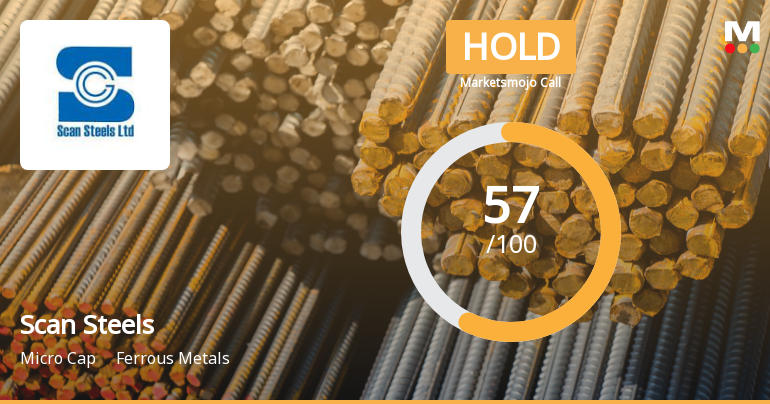
Scan Steels Ltd Downgraded to Hold Amid Mixed Financial and Valuation Signals
Scan Steels Ltd, a micro-cap player in the ferrous metals sector, has seen its investment rating downgraded from Buy to Hold as of 29 July 2026. This revision reflects a combination of deteriorating quality metrics, a tempered valuation outlook, mixed financial trends, and cautious technical signals despite recent strong price performance. The company’s Mojo Score now stands at 57.0, signalling a Hold recommendation, marking a significant shift from its previous Buy grade.
Read full news article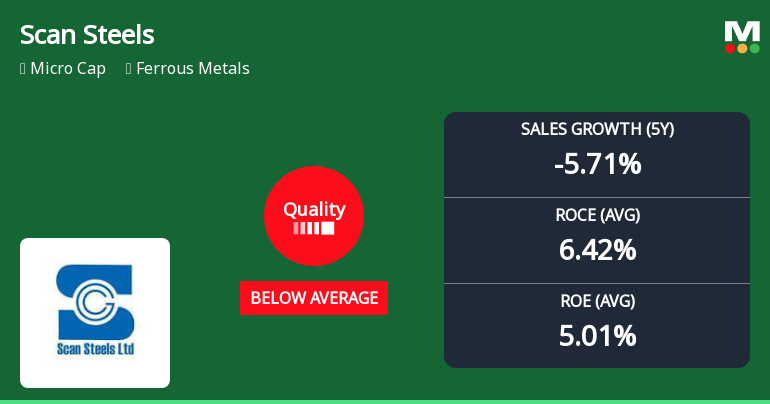
Scan Steels Ltd Downgraded to Hold as Quality Parameters Deteriorate Amid Volatile Returns
Scan Steels Ltd, a micro-cap player in the ferrous metals sector, has seen its quality rating downgraded from Buy to Hold following a marked deterioration in key business fundamentals. Despite a robust share price rally of 16.7% in a single day and a year-to-date return of 62.95%, the company’s underlying financial health reveals weakening growth and profitability metrics, prompting a reassessment of its investment appeal.
Read full news article Announcements
Announcement under Regulation 30 (LODR)-Newspaper Publication
29-Jul-2026 | Source : BSENewspaper Publication of Un-Audited Standalone & Consolidated Financial Results for the Quarter ended June 30 2026.
Announcement under Regulation 30 (LODR)-Press Release / Media Release
28-Jul-2026 | Source : BSESubmission of Press Release regarding Q1 and FY27 Financial & Operational Performance.
Board Meeting Outcome for Outcome Of Board Meeting -Un-Audited Standalone And Consolidated Financial Results Of The Company For The Quarter Ended June 30 2026.
28-Jul-2026 | Source : BSE1. Un-audited Standalone and Consolidated Financial Results of the Company for the quarter ended June 30 2026 along with the Limited Review Report of the Auditors thereon; 2. Re-appointment of Internal Auditor; 3. Re-appointment of Cost Auditor:.
Corporate Actions

No Upcoming Board Meetings

No Dividend history available

No Splits history available

No Bonus history available

No Rights history available
Quality key factors
Valuation key factors
Technicals key factors
 Technical Indicator Scale: Bearish, Mildly Bearish, Sideways, Mildly Bullish, Bullish Turned
 Shareholding Snapshot : Jun 2026
Shareholding Compare (%holding)
Promoters
None
Held by 0 Schemes
Held by 1 FIIs (1.98%)
Bayanwala Brothers Pvt Limited (16.36%)
Gopikar Supply Pvt Ltd (6.46%)
17.36%
Quarterly Results Snapshot (Consolidated) - Jun'26 - QoQ

QoQ Growth in quarter ended Jun 2026 is -8.47% vs 46.97% in Mar 2026
QoQ Growth in quarter ended Jun 2026 is 68.79% vs 125.57% in Mar 2026
Half Yearly Results Snapshot (Consolidated) - Sep'25

Growth in half year ended Sep 2025 is -2.29% vs -23.61% in Sep 2024
Growth in half year ended Sep 2025 is -22.25% vs 70.81% in Sep 2024
Nine Monthly Results Snapshot (Consolidated) - Dec'25
YoY Growth in nine months ended Dec 2025 is 1.57% vs -22.64% in Dec 2024
YoY Growth in nine months ended Dec 2025 is -16.20% vs 75.78% in Dec 2024
Annual Results Snapshot (Consolidated) - Mar'26
YoY Growth in year ended Mar 2026 is 6.22% vs -18.25% in Mar 2025
YoY Growth in year ended Mar 2026 is 1.66% vs 2.85% in Mar 2025
About Scan Steels Ltd

Company Coordinates


