
Compare Nahar Spinning with Similar Stocks
Dashboard
Weak Long Term Fundamental Strength with a -9.96% CAGR growth in Operating Profits over the last 5 years
- Low ability to service debt as the company has a high Debt to EBITDA ratio of 6.24 times
- The company has been able to generate a Return on Equity (avg) of 8.26% signifying low profitability per unit of shareholders funds
Flat results in Mar 26
With ROCE of 2.7, it has a Attractive valuation with a 0.8 Enterprise value to Capital Employed
Rising Promoter Confidence
Consistent Underperformance against the benchmark over the last 3 years
Stock DNA
Garments & Apparels
INR 921 Cr (Micro Cap)
42.00
25
0.38%
0.65
1.50%
0.63
Total Returns (Price + Dividend) 
Latest dividend: 1 per share ex-dividend date: Sep-04-2025
Risk Adjusted Returns v/s
Returns Beta

News

Nahar Spinning Mills Ltd Upgraded to Hold on Technical Improvements and Valuation Appeal
Nahar Spinning Mills Ltd has seen its investment rating upgraded from Sell to Hold, reflecting a notable improvement in technical indicators and valuation metrics despite ongoing challenges in its financial trend and long-term fundamentals. The upgrade, effective from 23 June 2026, is driven primarily by a bullish shift in technicals and an attractive valuation relative to peers, signalling cautious optimism for investors in this micro-cap garment and apparel company.
Read full news article
Nahar Spinning Mills Ltd Technical Momentum Shifts Signal Bullish Outlook
Nahar Spinning Mills Ltd has exhibited a notable shift in its technical momentum, moving from a mildly bullish stance to a more confident bullish trend. This change is underpinned by a confluence of technical indicators including MACD, RSI, moving averages, and Bollinger Bands, signalling a potential uptrend in the micro-cap garment and apparel stock. Investors and market analysts are closely monitoring these developments as the stock outperforms key benchmarks with a 2.15% gain on 24 June 2026.
Read full news article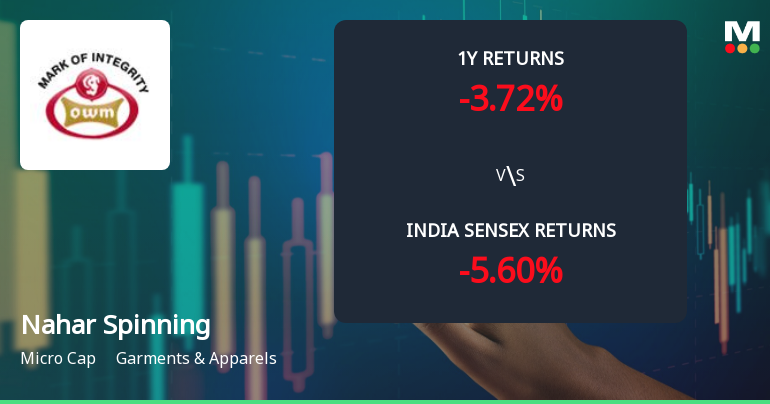
Nahar Spinning Mills Ltd Technical Momentum Shifts Amid Mixed Market Signals
Nahar Spinning Mills Ltd, a micro-cap player in the Garments & Apparels sector, has experienced a nuanced shift in its technical momentum, with several key indicators signalling a transition from bullish to mildly bullish territory. Despite a modest day decline of 0.43%, the stock’s technical parameters reveal a complex interplay of bullish and bearish signals, warranting a detailed analysis for investors navigating this evolving landscape.
Read full news article Announcements
Intimation To Shareholders For KYC Update
18-Jun-2026 | Source : BSEIntimation for Shareholder for mandatory furnishing of PANKYC details etc. is enclosed
Announcement under Regulation 30 (LODR)-Newspaper Publication
11-Jun-2026 | Source : BSECopy of Newspaper Publication is attached
Demat Report For The Month Of May 2026.
02-Jun-2026 | Source : BSEDemat report for the month of May 2026 is enclosed.
Corporate Actions

No Upcoming Board Meetings

Nahar Spinning Mills Ltd has declared 20% dividend, ex-date: 04 Sep 25

No Splits history available

No Bonus history available

No Rights history available
Quality key factors
Valuation key factors
Technicals key factors
 Technical Indicator Scale: Bearish, Mildly Bearish, Sideways, Mildly Bullish, Bullish Turned
 Shareholding Snapshot : Mar 2026
Shareholding Compare (%holding)
Promoters
None
Held by 3 Schemes (0.01%)
Held by 1 FIIs (0.08%)
Nahar Capital And Financial Services Ltd. (47.01%)
Anil Kumar Goel (5.14%)
27.05%
Quarterly Results Snapshot (Standalone) - Mar'26 - YoY

YoY Growth in quarter ended Mar 2026 is 4.71% vs 7.38% in Mar 2025
YoY Growth in quarter ended Mar 2026 is 4.51% vs 6,156.76% in Mar 2025
Half Yearly Results Snapshot (Standalone) - Sep'25
Growth in half year ended Sep 2025 is 0.11% vs 8.13% in Sep 2024

Growth in half year ended Sep 2025 is 204.62% vs 69.52% in Sep 2024
Nine Monthly Results Snapshot (Standalone) - Dec'25
YoY Growth in nine months ended Dec 2025 is -4.48% vs 7.80% in Dec 2024
YoY Growth in nine months ended Dec 2025 is 84.10% vs 80.16% in Dec 2024
Annual Results Snapshot (Standalone) - Mar'26
YoY Growth in year ended Mar 2026 is -2.03% vs 7.69% in Mar 2025
YoY Growth in year ended Mar 2026 is 76.68% vs 124.18% in Mar 2025
About Nahar Spinning Mills Ltd

Company Coordinates


