Ruby Mills

  • Market Cap: Micro Cap
  • Industry: Garments & Apparels
  • ISIN: INE301D01026
  • NSEID: RUBYMILLS
  • BSEID: 503169
INR
463.90
6.1 (1.33%)
BSENSE

Sep 18, 03:30 PM

BSE+NSE Vol: 42.47 k

  • Price Points
  • Score
  • Mojo Parameters
  • Total Return
  • News and Corporate Actions
  • Key factors
  • Shareholding
  • Financials
  • CompanyCV
stock-summaryPrice Point
High/Low

1Day

52 Week

Valuation
Technical
Day's Volume

CASH

42.47 k (12.62%) Volume

Shareholding (Jun 2026)

FII

0.02%

Held by 2 FIIs

DII

0.10%

Held by 0 DIIs

Promoter

74.90%

Why is Ruby Mills Ltd falling/rising?

06-Sep-2026

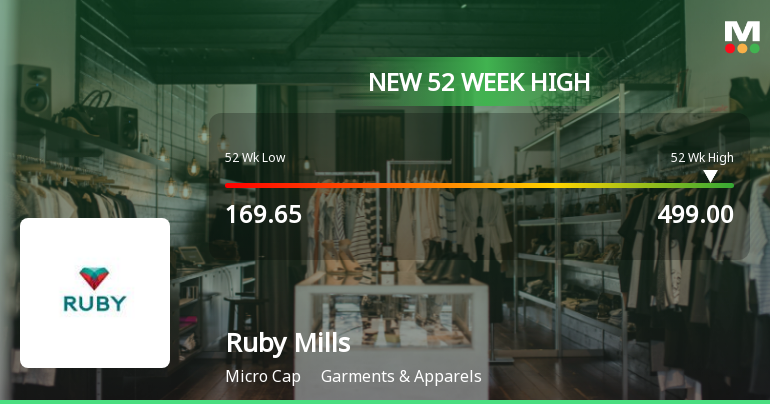
As of 05-Sep, Ruby Mills Ltd's stock price is at Rs. 427.40, having risen 3.95% recently and significantly outperforming the Sensex. The stock has shown strong momentum, reaching a 52-week high and experiencing increased investor interest.

As of 05-Sep, Ruby Mills Ltd's stock price is rising, currently at Rs. 427.40, reflecting an increase of Rs. 16.25 or 3.95%. The stock has shown strong performance over various periods, with a 7.67% increase over the past week and a remarkable 19.19% rise over the past month, significantly outperforming the Sensex, which has declined by 0.97% and 2.44% respectively during those periods. Year-to-date, Ruby Mills has surged by 94.27%, while the Sensex has fallen by 10.21%.<BR><BR>Today, the stock reached a new 52-week high of Rs. 431.5, indicating positive momentum. It has been gaining for the last four consecutive days, accumulating a total return of 9.96% during this time. Additionally, the stock's performance today outperformed its sector by 4.5%. The trading activity shows that Ruby Mills is currently trading above its 5-day, 20-day, 50-day, 100-day, and 200-day moving averages, which is a bullish indicator.<BR><BR>Investor participation has also increased, with delivery volume rising by 219.25% compared to the 5-day average, suggesting heightened interest in the stock. Overall, these factors contribute to the upward movement in Ruby Mills Ltd's stock price.

View full answer

Who are in the management team of Ruby Mills?

01-Sep-2026

The management team of Ruby Mills includes Executive Chairman Hiren Manharlal Shah, Managing Directors Bharat and Viraj Manharlal Shah, CEO Purav Shah, and several independent directors. They oversee the company's operations and strategic direction.

The management team of Ruby Mills includes the following key members:<BR><BR>1. **Hiren Manharlal Shah** - Executive Chairman<BR>2. **Bharat Manharlal Shah** - Managing Director<BR>3. **Viraj Manharlal Shah** - Managing Director<BR>4. **Purav Shah** - Executive Director & CEO<BR>5. **Shardul J Thacker** - Independent Director<BR>6. **Yogen Shivlal Lathia** - Independent Director<BR>7. **Mehernosh Rusi Currawalla** - Independent Director<BR>8. **Jasvanti Patel** - Independent Director<BR>9. **Rahul Divan** - Independent Director<BR>10. **Deepak R Shah** - Director<BR>11. **A M Shah** - Chairman Emeritus<BR>12. **Anuradha Tendulkar** - Company Secretary & Compliance Officer<BR><BR>This team is responsible for overseeing the operations and strategic direction of the company.

View full answer

What does Ruby Mills do?

01-Sep-2026

Ruby Mills Ltd is a micro-cap composite textile mill established in 1917, specializing in the manufacture of cotton and blended yarn and fabric. As of June 2026, it reported net sales of 91 Cr and a net profit of 12 Cr, with a market cap of INR 1,337 Cr.

Overview:<BR>Ruby Mills Ltd is a composite textile mill engaged in the manufacture of cotton and blended yarn and fabric, operating within the garments and apparels industry, categorized as a micro-cap company.<BR><BR>History:<BR>Incorporated in 1917, Ruby Mills has maintained its status as a textile manufacturer. The latest quarterly results reported net sales and net profit for June 2026.<BR><BR>Financial Snapshot:<BR>- Net Sales: 91 Cr (Quarterly Results - Jun 2026)<BR>- Net Profit: 12 Cr (Quarterly Results - Jun 2026)<BR>- Market Cap: INR 1,337 Cr (Micro Cap)<BR><BR>Key Metrics:<BR>- P/E: 30.00<BR>- Industry P/E: 28<BR>- Dividend Yield: 0.44%<BR>- Debt Equity: 0.47<BR>- Return on Equity: 6.43%<BR>- Price to Book: 1.97<BR><BR>Contact Details:<BR>Address: Ruby House, J K Sawant Marg Dadar Mumbai Maharashtra : 400028<BR>Tel: 91-22-24387800/30997800<BR>Email: info@rubymills.com<BR>Website: http://www.rubymills.com

View full answer

Who are the peers of the Ruby Mills?

01-Sep-2026

Ruby Mills' peers include Indo Rama Synth., Dollar Industrie, AYM Syntex, Pashupati Cotsp., Sai Silks, GHCL Textiles, Raj Rayon Inds., Faze Three, Century Enka, and Rupa & Co. GHCL Textiles leads in 1-year returns at 69.59%, while Ruby Mills shows a strong return of 79.14%.

Peers: The peers of Ruby Mills are Indo Rama Synth., Dollar Industrie, AYM Syntex, Pashupati Cotsp., Sai Silks, GHCL Textiles, Raj Rayon Inds., Faze Three, Century Enka, and Rupa & Co.<BR><BR>Quality Snapshot: Below Average management risk is observed at Indo Rama Synth., Ruby Mills, Pashupati Cotsp., Raj Rayon Inds., and the rest. Average management risk is found at Dollar Industrie, AYM Syntex, Sai Silks, GHCL Textiles, Faze Three, Century Enka, and Rupa & Co. Below Average growth is noted for Indo Rama Synth., Ruby Mills, Pashupati Cotsp., and the rest, while Average growth is seen at AYM Syntex, Dollar Industrie, and the rest. Excellent capital structure is present at GHCL Textiles and Century Enka, while Good capital structure is noted at Dollar Industrie, Sai Silks, and Faze Three, with Average capital structure at Ruby Mills.<BR><BR>Return Snapshot: GHCL Textiles has the highest 1-year return at 69.59%, while Dollar Industrie has the lowest at -23.55%. Ruby Mills' 1-year return of 79.14% is significantly higher than both. Additionally, peers such as Sai Silks and Pashupati Cotsp. have negative six-month returns.

View full answer

How big is Ruby Mills?

01-Sep-2026

As of 31st August, Ruby Mills Ltd has a market capitalization of 1,337.00 Cr, with recent net sales of 216.81 Cr and a net profit of 22.82 Cr. The company reported shareholder's funds of 636.68 Cr and total assets of 1,037.76 Cr for the annual period ending in March 2025.

As of 31st August, Ruby Mills Ltd has a market capitalization of 1,337.00 Cr, categorizing it as a Micro Cap company.<BR><BR>In the latest four quarters, Ruby Mills reported Net Sales of 216.81 Cr and a Net Profit of 22.82 Cr.<BR><BR>For the latest annual period ending in March 2025, the company had Shareholder's Funds of 636.68 Cr and Total Assets amounting to 1,037.76 Cr.

View full answer

Should I buy, sell or hold Ruby Mills Ltd.?

15-Aug-2026

When is the next results date for Ruby Mills Ltd.?

06-Aug-2026

The next results date for Ruby Mills Ltd. is 12 August 2026.

The next results date for Ruby Mills Ltd. is scheduled for 12 August 2026.

View full answer

Are Ruby Mills Ltd. latest results good or bad?

30-May-2026

Ruby Mills Ltd. reported strong Q4 FY26 results with a net profit of ₹11.05 crores and revenue of ₹123.38 crores, reflecting significant growth. However, concerns about low return on equity and negative cash flow indicate potential challenges ahead, suggesting a cautious outlook for investors.

Ruby Mills Ltd. has reported impressive results for Q4 FY26, showcasing significant growth in both revenue and net profit. The company achieved a net profit of ₹11.05 crores, reflecting a staggering 15,685.71% increase quarter-on-quarter. Revenue for the same period reached ₹123.38 crores, marking a remarkable 9,539.06% growth compared to the previous quarter.<BR><BR>Additionally, the operating margin of 27.57% is the highest on record for the company, indicating strong operational efficiency. However, while these figures are striking, it's important to consider the context. The previous quarter's revenue was exceptionally low, which makes the current results appear more dramatic.<BR><BR>On the downside, the return on equity (ROE) stands at 7.42%, which is below industry standards, raising concerns about capital efficiency. Furthermore, the company has faced challenges with cash flow, reporting negative operating cash flow of -₹35.00 crores in FY25, despite a profit before tax of ₹53.00 crores.<BR><BR>Overall, while the latest results show strong growth and operational improvements, the underlying issues related to capital efficiency and cash flow management suggest a cautious outlook. Investors should monitor future performance closely to see if the company can sustain this momentum and address its financial challenges.

View full answer

How has been the historical performance of Ruby Mills?

01-Dec-2025

Ruby Mills has shown growth in capital structure and reserves from March 2019 to March 2025, with total assets and shareholder funds increasing significantly. However, it faced challenges in cash flow management, reporting a decline to -35.00 Cr in operating activities by March 2025.

Answer:<BR>The historical performance of Ruby Mills shows a range of financial metrics over the years, particularly focusing on the fiscal year ending in March 2019 and subsequent years leading up to March 2025.<BR><BR>Breakdown:<BR>In March 2019, Ruby Mills reported net sales of 2.52 Cr, with total operating income also at 2.52 Cr. The total expenditure, excluding depreciation, was 2.32 Cr, resulting in an operating profit (PBDIT) of 0.21 Cr. After accounting for taxes of 0.06 Cr, the profit after tax stood at 0.15 Cr, leading to an earnings per share (EPS) of 0.12. The operating profit margin was recorded at 7.94%, while the profit after tax margin was 5.95%. By March 2025, the company's share capital increased to 16.72 Cr, and total reserves rose significantly to 619.96 Cr. Shareholder's funds reached 636.68 Cr, while total liabilities amounted to 1,037.76 Cr. The total assets also increased to 1,037.76 Cr, indicating a stable growth trajectory. However, cash flow from operating activities showed a decline to -35.00 Cr in March 2025, contrasting with previous years where it was positive. Overall, Ruby Mills has demonstrated growth in its capital structure and reserves, but challenges in cash flow management have emerged in recent years.

View full answer

Is Ruby Mills technically bullish or bearish?

29-Nov-2025

As of November 28, 2025, Ruby Mills has shifted to a mildly bearish trend, indicated by bearish weekly and monthly MACD signals, Bollinger Bands, and KST, despite mildly bullish daily moving averages, with a recent 1-week return of -3.62% contrasting with a positive Sensex return.

As of 28 November 2025, the technical trend for Ruby Mills has changed from mildly bullish to mildly bearish. The current stance is mildly bearish, driven by weekly and monthly MACD indicators both showing bearish signals. Bollinger Bands and KST also indicate bearish conditions on both time frames. Although the daily moving averages are mildly bullish, the overall weekly and monthly indicators suggest a weakening trend. The Dow Theory presents a mixed view with weekly mildly bullish but monthly mildly bearish signals. The stock's recent performance shows a significant decline, with a 1-week return of -3.62% compared to a positive Sensex return, further supporting the bearish outlook.

View full answer

Is Ruby Mills overvalued or undervalued?

29-Nov-2025

As of November 28, 2025, Ruby Mills is considered an attractive investment due to its undervalued metrics, including a PE ratio of 13.81 and a PEG ratio of 0.36, despite a recent stock decline of 18.02%.

As of 28 November 2025, Ruby Mills has moved from a fair to a very attractive valuation grade. The company is currently undervalued, with a PE ratio of 13.81, a Price to Book Value of 1.14, and an EV to EBITDA of 18.37. Compared to peers, Ruby Mills stands out favorably; for instance, K P R Mill Ltd is considered very expensive with a PE ratio of 44.04, while Trident, which is attractive, has a PE ratio of 32.54.<BR><BR>Despite recent stock performance showing a decline of 18.02% over the past year compared to a Sensex return of 8.43%, Ruby Mills' valuation metrics suggest significant upside potential. The PEG ratio of 0.36 further indicates that the stock is undervalued relative to its growth prospects, reinforcing the conclusion that Ruby Mills is an attractive investment opportunity in the garments and apparels industry.

View full answer

Who are the top shareholders of the Ruby Mills?

17-Jul-2025

The top shareholders of Ruby Mills include Manubhai And Sons Investment Co Pvt Ltd with 14.29%, Adrik Traders Pvt. Ltd. with 2.92%, and individual investors holding 18.77%. There are no pledged promoter holdings or mutual funds invested in the company.

The top shareholders of Ruby Mills include the promoters, who hold the majority of the shares. The promoter with the highest holding is Manubhai And Sons Investment Co Pvt Ltd, which owns 14.29% of the company. Additionally, the highest public shareholder is Adrik Traders Pvt. Ltd., holding 2.92%. Individual investors collectively hold 18.77% of the shares, while there are also 2 foreign institutional investors (FIIs) that hold a combined 0.02%. Notably, there are no pledged promoter holdings and no mutual funds currently invested in the company.

View full answer

What is the bonus history of the Ruby Mills?

06-Jun-2025

Ruby Mills has issued bonuses to shareholders consistently, with the most recent being a 1:1 bonus announced on September 23, 2022, and a previous 1:1 bonus on October 21, 2015.

Ruby Mills has a history of issuing bonuses to its shareholders. The most recent bonus was a 1:1 bonus issue, which was announced with an ex-date of September 23, 2022, and a record date of September 26, 2022. Prior to that, the company also issued a 1:1 bonus on October 21, 2015, with a record date of October 24, 2015. This indicates a consistent approach to rewarding shareholders through bonus issues.

View full answer

Has Ruby Mills declared dividend?

06-Jun-2025

Ruby Mills Ltd. has declared a 35% dividend, amounting to ₹1.75 per share, with an ex-date of September 13, 2024. While recent returns have shown volatility, the company has demonstrated strong long-term growth, particularly in price appreciation.

Ruby Mills Ltd. has declared a 35% dividend.<BR><BR>Dividend Details:<BR>- Percentage announced: 35%<BR>- Amount per share: 1.75<BR>- Ex-date: 13 Sep 24<BR><BR>Dividend Yield: 0.83%.<BR><BR>Total Returns by Period:<BR>In the last 6 months, Ruby Mills experienced a price return of -22.14% with no dividend return, resulting in a total return of -22.14%.<BR><BR>Over the past year, the company achieved a price return of 3.93% and a dividend return of 0.85%, leading to a total return of 4.78%.<BR><BR>In a 2-year period, Ruby Mills recorded a price return of 11.24% and a dividend return of 1.44%, culminating in a total return of 12.68%.<BR><BR>For the last 3 years, the price return was 3.88% with a dividend return of 3.38%, resulting in a total return of 7.26%.<BR><BR>Over a 4-year span, the company saw a significant price return of 80.47% and a dividend return of 5.72%, achieving a total return of 86.19%.<BR><BR>In the 5-year period, Ruby Mills had an impressive price return of 146.34% along with a dividend return of 8.36%, leading to a total return of 154.7%.<BR><BR>Overall, Ruby Mills has declared a substantial dividend, and while the recent total returns have shown some volatility, the longer-term returns indicate strong growth, particularly in price appreciation.

View full answer
iScoreScore
Click here to find our call on this stock
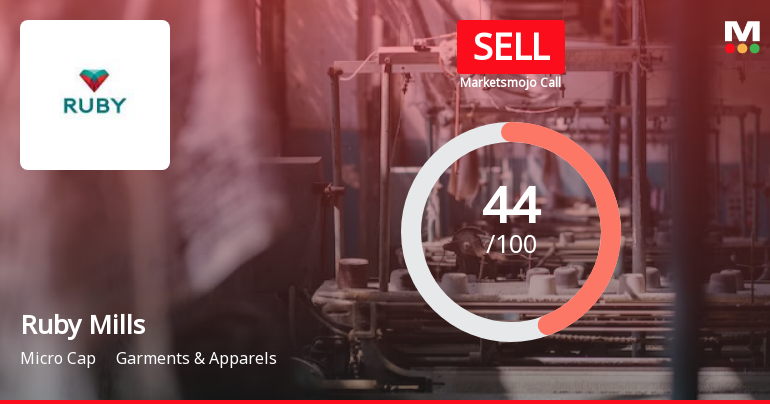
Strong Sell
Sell
Hold
Buy
Strong Buy

Dashboard

1

Weak Long Term Fundamental Strength with an average Return on Capital Employed (ROCE) of 5.33%

  • Poor long term growth as Operating profit has grown by an annual rate 11.91% of over the last 5 years
2

Flat results in Jun 26

3

With ROCE of 5.1, it has a Very Expensive valuation with a 1.9 Enterprise value to Capital Employed

4

Despite the size of the company, domestic mutual funds hold only 0% of the company

stock-summaryMojo Parameters

Mojo Parameters

Loading Valuation Snapshot...

Stock DNA

stock-summary
Industry

Garments & Apparels

stock-summary
Market cap

INR 1,506 Cr (Micro Cap)

stock-summary
P/E

37.00

stock-summary
Industry P/E

28

stock-summary
Dividend Yield

0.55%

stock-summary
Debt Equity

0.47

stock-summary
Return on Equity

6.43%

stock-summary
Price to Book

2.27

Revenue and Profits:
Net Sales:
91 Cr
(Quarterly Results - Jun 2026)
Net Profit:
12 Cr
stock-summaryTotal Returns
Total Returns (Price + Dividend) stock-summary
Dividend Yield (0.55%)
TimePeriod
Price Return
Dividend Return
Total Return
3 Months
38.11%
0.74%
38.85%
6 Months
131.31%
1.25%
132.56%
1 Year
97.15%
1.09%
98.24%
2 Years
57.39%
1.48%
58.87%
3 Years
87.97%
2.51%
90.48%
4 Years
37.9%
2.71%
40.61%
5 Years
228.26%
5.79%
234.05%

Latest dividend: 2.4994540292640317 per share ex-dividend date: Sep-17-2026

Risk Adjusted Returns v/s stock-summary
Returns Beta
Icon
Beta has not been calculated since enough price history is not available
stock-summaryNews & Corporate Actions

News

Announcements stock-summary

Announcement under Regulation 30 (LODR)-Newspaper Publication

03-Sep-2026 | Source : BSE

Newspaper clipping regarding Notice to Shareholders in respect of 110th Annual General Meeting.

Intimation Under Regulation 30 Regarding KYC Letter Dispatched To The Shareholders Of The Company

03-Sep-2026 | Source : BSE

Intimation Under Regulation 30 Regarding KYC Letter Dispatched To The Shareholders Of The Company

Letter To Shareholders Pursuant To 36(1)(B) Of SEBI LODR 2015

03-Sep-2026 | Source : BSE

Letter to Shareholders pursuant to 36(1)(b) of SEBI LODR 2015.

Corporate Actions stock-summary

stock-summary
BOARD MEETING

No Upcoming Board Meetings

stock-summary
DIVIDEND

Ruby Mills Ltd has declared 50% dividend, ex-date: 17 Sep 26

stock-summary
SPLITS

Ruby Mills Ltd has announced 5:10 stock split, ex-date: 22 Nov 12

stock-summary
BONUS

Ruby Mills Ltd has announced 1:1 bonus issue, ex-date: 23 Sep 22

stock-summary
RIGHTS

No Rights history available

stock-summaryKey Factors

Quality key factors stock-summary

Factor
Value
Sales Growth (5y)
21.96%
EBIT Growth (5y)
11.91%
EBIT to Interest (avg)
7.04
Debt to EBITDA (avg)
6.96
Net Debt to Equity (avg)
0.47
Sales to Capital Employed (avg)
0.25
Tax Ratio
18.28%
Dividend Payout Ratio
13.83%
Pledged Shares
0
Institutional Holding
0.12%
ROCE (avg)
4.71%
ROE (avg)
6.61%

Valuation key factors

Factor
Value
P/E Ratio
37
Industry P/E
28
Price to Book Value
2.37
EV to EBIT
34.65
EV to EBITDA
21.30
EV to Capital Employed
1.94
EV to Sales
5.04
PEG Ratio
NA
Dividend Yield
0.52%
ROCE (Latest)
5.14%
ROE (Latest)
6.43%

Technicals key factors

Indicator
Weekly
Monthly
MACD
Bullish
Bullish
RSI
No Signal
No Signal
Bollinger Bands
Bullish
Bullish
Moving Averages
Bullish (Daily)
KST
Mildly Bearish
Bullish
Dow Theory
Bullish
Bullish
OBV
Bullish
Bullish
stock-summary Technical Indicator Scale: Bearish, Mildly Bearish, Sideways, Mildly Bullish, Bullish  Turned 
stock-summaryShareholding
Shareholding Snapshot : Jun 2026stock-summary
Shareholding Compare (%holding) stock-summary
Majority shareholders

Promoters

Pledged Promoter Holdings

None

Mutual Funds

Held by 0 Schemes

FIIs

Held by 2 FIIs (0.02%)

Promoter with highest holding

Manubhai And Sons Investment Co Pvt Ltd (14.29%)

Highest Public shareholder

Adrik Traders Pvt.ltd. (2.92%)

Individual Investors Holdings

18.01%

stock-summaryFinancial
[
  {
    "link": "quarterly",
    "btn_text": "All Quarterly Results",
    "header": "Quarterly Results Snapshot (Standalone) - Jun'26 - QoQ",
    "rhs": [
      {
        "prefix": "Net Sales ",
        "suffix": "QoQ Growth in quarter ended Jun 2026 is -25.86% vs 54.22% in Mar 2026",
        "dir": -1
      },
      {
        "prefix": "Standalone Net Profit ",
        "suffix": "QoQ Growth in quarter ended Jun 2026 is 6.78% vs 17.02% in Mar 2026",
        "dir": -1
      }
    ],
    "table": {
      "header": [
        "Jun'26",
        "Mar'26",
        "Change(%)"
      ],
      "body": [
        {
          "field": "Net Sales",
          "val1": "91.48",
          "val2": "123.38",
          "chgp": "-25.86%",
          "chgp_class": "negative"
        },
        {
          "field": "Operating Profit (PBDIT) excl Other Income",
          "val1": "25.52",
          "val2": "34.04",
          "chgp": "-25.03%",
          "chgp_class": "negative"
        },
        {
          "field": "Interest",
          "val1": "9.88",
          "val2": "9.02",
          "chgp": "9.53%",
          "chgp_class": "negative"
        },
        {
          "field": "Exceptional Items",
          "val1": "0.00",
          "val2": "0.00",
          "chgp": "",
          "chgp_class": "neutral"
        },
        {
          "field": "Standalone Net Profit",
          "val1": "11.82",
          "val2": "11.07",
          "chgp": "6.78%",
          "chgp_class": "positive"
        },
        {
          "field": "Operating Profit Margin (Excl OI)",
          "val1": "27.90%",
          "val2": "27.59%",
          "chgp": "0.31%",
          "chgp_class": "positive"
        }
      ]
    }
  },
  {
    "link": "half-yearly",
    "btn_text": "All Half Yearly Results",
    "header": "Half Yearly Results Snapshot (Standalone) - Sep'25",
    "rhs": [
      {
        "prefix": "Net Sales ",
        "suffix": " Growth in half year ended Sep 2025 is 57.18% vs -7.69% in Sep 2024",
        "dir": 1
      },
      {
        "prefix": "Standalone Net Profit ",
        "suffix": " Growth in half year ended Sep 2025 is 98.71% vs -33.06% in Sep 2024",
        "dir": 1
      }
    ],
    "table": {
      "header": [
        "Sep'25",
        "Sep'24",
        "Change(%)"
      ],
      "body": [
        {
          "field": "Net Sales",
          "val1": "155.22",
          "val2": "98.75",
          "chgp": "57.18%",
          "chgp_class": "positive"
        },
        {
          "field": "Operating Profit (PBDIT) excl Other Income",
          "val1": "27.03",
          "val2": "17.63",
          "chgp": "53.32%",
          "chgp_class": "positive"
        },
        {
          "field": "Interest",
          "val1": "1.73",
          "val2": "2.71",
          "chgp": "-36.16%",
          "chgp_class": "positive"
        },
        {
          "field": "Exceptional Items",
          "val1": "0.00",
          "val2": "0.00",
          "chgp": "",
          "chgp_class": "neutral"
        },
        {
          "field": "Standalone Net Profit",
          "val1": "23.05",
          "val2": "11.60",
          "chgp": "98.71%",
          "chgp_class": "positive"
        },
        {
          "field": "Operating Profit Margin (Excl OI)",
          "val1": "17.41%",
          "val2": "17.85%",
          "chgp": "-0.44%",
          "chgp_class": "negative"
        }
      ]
    }
  },
  {
    "link": "nine-monthly",
    "btn_text": "All Nine Monthly Results",
    "header": "Nine Monthly Results Snapshot (Standalone) - Dec'25",
    "rhs": [
      {
        "prefix": "Net Sales ",
        "suffix": "YoY Growth in nine months ended Dec 2025 is 43.62% vs 0.15% in Dec 2024",
        "dir": 1
      },
      {
        "prefix": "Standalone Net Profit ",
        "suffix": "YoY Growth in nine months ended Dec 2025 is 23.61% vs -7.46% in Dec 2024",
        "dir": 1
      }
    ],
    "table": {
      "header": [
        "Dec'25",
        "Dec'24",
        "Change(%)"
      ],
      "body": [
        {
          "field": "Net Sales",
          "val1": "235.22",
          "val2": "163.78",
          "chgp": "43.62%",
          "chgp_class": "positive"
        },
        {
          "field": "Operating Profit (PBDIT) excl Other Income",
          "val1": "41.35",
          "val2": "31.53",
          "chgp": "31.14%",
          "chgp_class": "positive"
        },
        {
          "field": "Interest",
          "val1": "6.41",
          "val2": "3.85",
          "chgp": "66.49%",
          "chgp_class": "negative"
        },
        {
          "field": "Exceptional Items",
          "val1": "0.00",
          "val2": "0.00",
          "chgp": "",
          "chgp_class": "neutral"
        },
        {
          "field": "Standalone Net Profit",
          "val1": "32.51",
          "val2": "26.30",
          "chgp": "23.61%",
          "chgp_class": "positive"
        },
        {
          "field": "Operating Profit Margin (Excl OI)",
          "val1": "17.58%",
          "val2": "19.25%",
          "chgp": "-1.67%",
          "chgp_class": "negative"
        }
      ]
    }
  },
  {
    "link": "annual",
    "btn_text": "All Annual Results",
    "header": "Annual Results Snapshot (Standalone) - Mar'26",
    "rhs": [
      {
        "prefix": "Net Sales ",
        "suffix": "YoY Growth in year ended Mar 2026 is 46.16% vs 3.51% in Mar 2025",
        "dir": 1
      },
      {
        "prefix": "Standalone Net Profit ",
        "suffix": "YoY Growth in year ended Mar 2026 is 3.00% vs -5.01% in Mar 2025",
        "dir": 1
      }
    ],
    "table": {
      "header": [
        "Mar'26",
        "Mar'25",
        "Change(%)"
      ],
      "body": [
        {
          "field": "Net Sales",
          "val1": "358.60",
          "val2": "245.34",
          "chgp": "46.16%",
          "chgp_class": "positive"
        },
        {
          "field": "Operating Profit (PBDIT) excl Other Income",
          "val1": "75.39",
          "val2": "45.41",
          "chgp": "66.02%",
          "chgp_class": "positive"
        },
        {
          "field": "Interest",
          "val1": "15.42",
          "val2": "4.75",
          "chgp": "224.63%",
          "chgp_class": "negative"
        },
        {
          "field": "Exceptional Items",
          "val1": "0.00",
          "val2": "0.00",
          "chgp": "",
          "chgp_class": "neutral"
        },
        {
          "field": "Standalone Net Profit",
          "val1": "43.58",
          "val2": "42.31",
          "chgp": "3.00%",
          "chgp_class": "positive"
        },
        {
          "field": "Operating Profit Margin (Excl OI)",
          "val1": "21.02%",
          "val2": "18.51%",
          "chgp": "2.51%",
          "chgp_class": "positive"
        }
      ]
    }
  }
]

Quarterly Results Snapshot (Standalone) - Jun'26 - QoQstock-summary

Jun'26
Mar'26
Change(%)
Net Sales
91.48
123.38
-25.86%
Operating Profit (PBDIT) excl Other Income
25.52
34.04
-25.03%
Interest
9.88
9.02
9.53%
Exceptional Items
0.00
0.00
Standalone Net Profit
11.82
11.07
6.78%
Operating Profit Margin (Excl OI)
27.90%
27.59%
0.31%
Values in Rs Cr.
Direction Arrows
Net Sales

QoQ Growth in quarter ended Jun 2026 is -25.86% vs 54.22% in Mar 2026

Direction Arrows
Standalone Net Profit

QoQ Growth in quarter ended Jun 2026 is 6.78% vs 17.02% in Mar 2026

Half Yearly Results Snapshot (Standalone) - Sep'25stock-summary

Sep'25
Sep'24
Change(%)
Net Sales
155.22
98.75
57.18%
Operating Profit (PBDIT) excl Other Income
27.03
17.63
53.32%
Interest
1.73
2.71
-36.16%
Exceptional Items
0.00
0.00
Standalone Net Profit
23.05
11.60
98.71%
Operating Profit Margin (Excl OI)
17.41%
17.85%
-0.44%
Values in Rs Cr.
Direction Arrows
Net Sales

Growth in half year ended Sep 2025 is 57.18% vs -7.69% in Sep 2024

Direction Arrows
Standalone Net Profit

Growth in half year ended Sep 2025 is 98.71% vs -33.06% in Sep 2024

Nine Monthly Results Snapshot (Standalone) - Dec'25stock-summary

Dec'25
Dec'24
Change(%)
Net Sales
235.22
163.78
43.62%
Operating Profit (PBDIT) excl Other Income
41.35
31.53
31.14%
Interest
6.41
3.85
66.49%
Exceptional Items
0.00
0.00
Standalone Net Profit
32.51
26.30
23.61%
Operating Profit Margin (Excl OI)
17.58%
19.25%
-1.67%
Values in Rs Cr.
Direction Arrows
Net Sales

YoY Growth in nine months ended Dec 2025 is 43.62% vs 0.15% in Dec 2024

Direction Arrows
Standalone Net Profit

YoY Growth in nine months ended Dec 2025 is 23.61% vs -7.46% in Dec 2024

Annual Results Snapshot (Standalone) - Mar'26stock-summary

Mar'26
Mar'25
Change(%)
Net Sales
358.60
245.34
46.16%
Operating Profit (PBDIT) excl Other Income
75.39
45.41
66.02%
Interest
15.42
4.75
224.63%
Exceptional Items
0.00
0.00
Standalone Net Profit
43.58
42.31
3.00%
Operating Profit Margin (Excl OI)
21.02%
18.51%
2.51%
Values in Rs Cr.
Direction Arrows
Net Sales

YoY Growth in year ended Mar 2026 is 46.16% vs 3.51% in Mar 2025

Direction Arrows
Standalone Net Profit

YoY Growth in year ended Mar 2026 is 3.00% vs -5.01% in Mar 2025

stock-summaryCompany CV
About Ruby Mills Ltd stock-summary
stock-summary
Ruby Mills Ltd
Micro Cap
Garments & Apparels
The Ruby Mills Limited (TRML), incorporated in 1917, is a composite Textile Mill engaged in manufacture of Cotton/Blended Yarn and Fabric. It has 3 plants at Mumbai, Village Dhamni & Village Kharsundi, at Khopoli, Taluka Khalapur, Dist. Raigad. The Company's entire Spinning & Weaving plants are at Village Dhamni and fabric processing activity at Mumbai which is being shifted at Village Kharsundi, Khopoli. Ruby Impex is the wholly owned subsidiary of the company.
Company Coordinates stock-summary
Company Details
Ruby House, J K Sawant Marg Dadar Mumbai Maharashtra : 400028
stock-summary
Tel: 91-22-24387800/30997800
stock-summary
info@rubymills.com
Registrar Details
Bigshare Services Pvt Ltd , E-2 , Ansa Industrial Estate, Saki Vihar Road, Saki Naka, Andheri (E), Mumbai