
Compare Nalin Lease Fin. with Similar Stocks
Stock DNA
Non Banking Financial Company (NBFC)
INR 25 Cr (Micro Cap)
8.00
21
0.00%
0.27
8.29%
0.65
Total Returns (Price + Dividend) 
Latest dividend: 0.4585185185185185 per share ex-dividend date: Aug-30-2021
Risk Adjusted Returns v/s
Returns Beta

News

Nalin Lease Finance Ltd is Rated Strong Sell
Nalin Lease Finance Ltd is rated Strong Sell by MarketsMOJO, with this rating last updated on 04 Jun 2025. However, the analysis and financial metrics discussed here reflect the stock’s current position as of 28 May 2026, providing investors with an up-to-date view of the company’s fundamentals, returns, and market performance.
Read full news article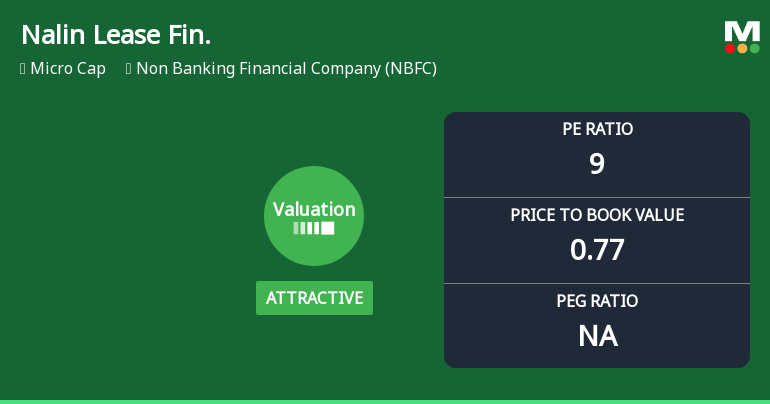
Nalin Lease Finance Ltd Valuation Shifts Signal Changing Price Attractiveness
Nalin Lease Finance Ltd has witnessed a notable shift in its valuation parameters, moving from a very attractive to an attractive rating, reflecting evolving market perceptions amid mixed financial metrics and sector dynamics. Despite a recent downgrade in its overall Mojo Grade to Strong Sell, the company’s price-to-earnings and price-to-book ratios suggest a more enticing entry point relative to peers and historical averages.
Read full news article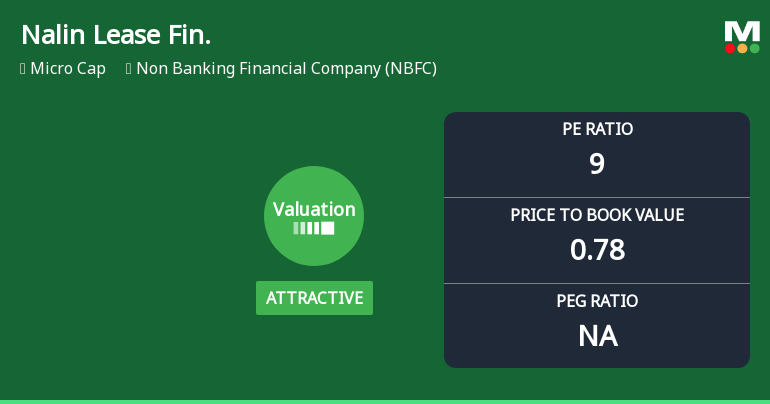
Nalin Lease Finance Ltd Valuation Shifts Signal Renewed Price Attractiveness
Nalin Lease Finance Ltd, a micro-cap player in the Non Banking Financial Company (NBFC) sector, has seen its valuation parameters improve from very attractive to attractive, signalling a shift in price appeal despite a challenging return profile over the past year. This article analyses the recent changes in key valuation metrics such as price-to-earnings (P/E) and price-to-book value (P/BV) ratios, compares them with peer averages and historical benchmarks, and assesses the implications for investors amid the company’s mixed performance relative to the broader market.
Read full news article Announcements
Disclosures under Reg. 29(2) of SEBI (SAST) Regulations 2011
03-Jun-2026 | Source : BSEThe Exchange has received the disclosure under Regulation 29(2) of SEBI (Substantial Acquisition of Shares & Takeovers) Regulations 2011 for NPLUS Consultants Pvt Ltd
Disclosures under Reg. 29(2) of SEBI (SAST) Regulations 2011
03-Jun-2026 | Source : BSEThe Exchange has received the disclosure under Regulation 29(2) of SEBI (Substantial Acquisition of Shares & Takeovers) Regulations 2011 for Dilipkumar Gandhi
Compliances-Reg.24(A)-Annual Secretarial Compliance
30-May-2026 | Source : BSESubmission of Annual Secretarial Compliance Report for the Financial Year ended March 312026
Corporate Actions

No Upcoming Board Meetings

Nalin Lease Finance Ltd has declared 5% dividend, ex-date: 30 Aug 21

No Splits history available

No Bonus history available

No Rights history available
Quality key factors
Valuation key factors
Technicals key factors
 Technical Indicator Scale: Bearish, Mildly Bearish, Sideways, Mildly Bullish, Bullish Turned
 Shareholding Snapshot : Mar 2026
Shareholding Compare (%holding)
Promoters
None
Held by 0 Schemes
Held by 0 FIIs
Dilipkumar Nalinkant Gandhi (43.32%)
Patel Hemantkumar Kiranbhai (2.35%)
24.29%
Quarterly Results Snapshot (Standalone) - Mar'26 - YoY

YoY Growth in quarter ended Mar 2026 is -14.56% vs -33.12% in Mar 2025
YoY Growth in quarter ended Mar 2026 is 29.82% vs -40.63% in Mar 2025
Half Yearly Results Snapshot (Standalone) - Sep'25

Growth in half year ended Sep 2025 is 7.96% vs 13.38% in Sep 2024
Growth in half year ended Sep 2025 is -13.33% vs 7.73% in Sep 2024
Nine Monthly Results Snapshot (Standalone) - Dec'25
YoY Growth in nine months ended Dec 2025 is 11.41% vs 3.81% in Dec 2024
YoY Growth in nine months ended Dec 2025 is -17.29% vs 2.08% in Dec 2024
Annual Results Snapshot (Standalone) - Mar'26
YoY Growth in year ended Mar 2026 is 6.73% vs -5.11% in Mar 2025
YoY Growth in year ended Mar 2026 is -9.66% vs -8.57% in Mar 2025
About Nalin Lease Finance Ltd

Company Coordinates


