
Compare Nandan Denim with Similar Stocks
Dashboard
Poor Management Efficiency with a low ROCE of 8.35%
- The company has been able to generate a Return on Capital Employed (avg) of 8.35% signifying low profitability per unit of total capital (equity and debt)
Low ability to service debt as the company has a high Debt to EBITDA ratio of 1.85 times
The company has declared Negative results for the last 3 consecutive quarters
Below par performance in long term as well as near term
Stock DNA
Garments & Apparels
INR 356 Cr (Micro Cap)
11.00
23
0.00%
0.30
5.18%
0.57
Total Returns (Price + Dividend) 
Latest dividend: 0 per share ex-dividend date: Sep-05-2019
Risk Adjusted Returns v/s
Returns Beta

News

Nandan Denim Ltd Upgraded to 'Sell' by MarketsMOJO Amid Mixed Financial Signals
Nandan Denim Ltd, a micro-cap player in the Garments & Apparels sector, has seen its investment rating upgraded from Strong Sell to Sell as of 29 May 2026. This change reflects a reassessment across four critical parameters: Quality, Valuation, Financial Trend, and Technicals. Despite ongoing challenges, the company’s improving fundamentals and attractive valuation have prompted a more favourable outlook, though caution remains warranted given recent financial performance.
Read full news article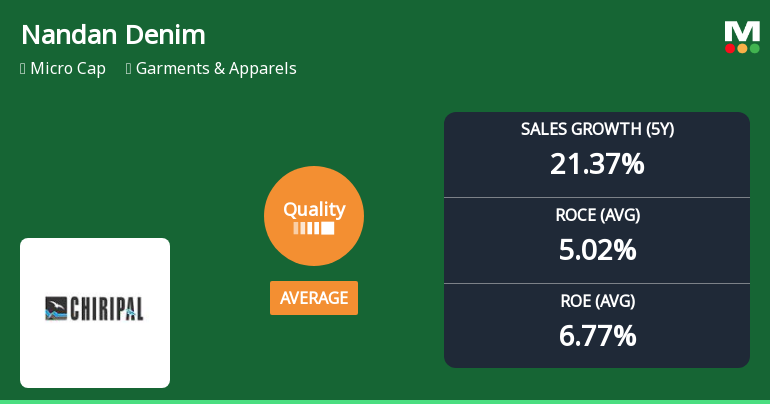
Nandan Denim Ltd Quality Grade Upgrade Signals Mixed Business Fundamentals
Nandan Denim Ltd has seen its quality grade improve from below average to average, reflecting a nuanced shift in its business fundamentals. While key metrics such as sales and EBIT growth have strengthened considerably over the past five years, concerns remain around capital efficiency and debt levels. This article analyses the company’s financial health, profitability, and operational consistency to provide a comprehensive view of its current standing in the Garments & Apparels sector.
Read full news articleAre Nandan Denim Ltd latest results good or bad?
Nandan Denim Ltd's latest financial results for Q4 FY26 reveal significant operational challenges. The company reported net sales of ₹539.98 crores, which reflects a substantial year-on-year decline of 48.51% from the previous year. This decline indicates a troubling trend in revenue generation, as it also represents an 8.10% decrease compared to the previous quarter. Net profit for the quarter stood at ₹9.51 crores, down 10.37% year-on-year and 15.09% sequentially. While the profit before tax margin improved slightly, this was largely due to a heavy reliance on non-operating income, which constituted 62.52% of profit before tax, raising concerns about the sustainability of the company's earnings. Operating margins fell to 2.41%, marking the lowest level in seven quarters, and the return on equity was recorded at 5.35%, significantly below industry standards. This points to inefficiencies in capital util...
Read full news article Announcements
Compliances-Reg.24(A)-Annual Secretarial Compliance
30-May-2026 | Source : BSEAnnual Secretarial Compliance for the Financial Year 2025-26
Announcement under Regulation 30 (LODR)-Newspaper Publication
29-May-2026 | Source : BSESubmission of Newspaper publication of Audited Financial Results for the Quarter and Year ended on March 31 2026.
Board Meeting Outcome for Outcome Of Board Meeting Of Nandan Denim Limited Held On 28Th May 2026.
28-May-2026 | Source : BSEAudited Financial Results for the Quarter and year ended on March 31 2026 and other matters noted and approved.
Corporate Actions

No Upcoming Board Meetings

Nandan Denim Ltd has declared 5% dividend, ex-date: 05 Sep 19

Nandan Denim Ltd has announced 1:10 stock split, ex-date: 19 Sep 24

Nandan Denim Ltd has announced 2:1 bonus issue, ex-date: 24 Mar 22

Nandan Denim Ltd has announced 1:2 rights issue, ex-date: 12 Dec 07
Quality key factors
Valuation key factors
Technicals key factors
 Technical Indicator Scale: Bearish, Mildly Bearish, Sideways, Mildly Bullish, Bullish Turned
 Shareholding Snapshot : Mar 2026
Shareholding Compare (%holding)
Promoters
None
Held by 0 Schemes
Held by 4 FIIs (0.68%)
Chiripal Industries Limited (24.96%)
Nakshatra Stressed Assets Fund Scheme I (1.31%)
39.53%
Quarterly Results Snapshot (Standalone) - Mar'26 - QoQ

QoQ Growth in quarter ended Mar 2026 is 8.10% vs -36.34% in Dec 2025
QoQ Growth in quarter ended Mar 2026 is 220.20% vs -68.57% in Dec 2025
Half Yearly Results Snapshot (Standalone) - Sep'25

Growth in half year ended Sep 2025 is 16.57% vs 62.25% in Sep 2024
Growth in half year ended Sep 2025 is 26.92% vs 64.18% in Sep 2024
Nine Monthly Results Snapshot (Standalone) - Dec'25
YoY Growth in nine months ended Dec 2025 is -6.65% vs 74.57% in Dec 2024
YoY Growth in nine months ended Dec 2025 is 3.37% vs 27.87% in Dec 2024
Annual Results Snapshot (Standalone) - Mar'26
YoY Growth in year ended Mar 2026 is -19.03% vs 76.44% in Mar 2025
YoY Growth in year ended Mar 2026 is -0.99% vs -25.55% in Mar 2025
About Nandan Denim Ltd

Company Coordinates


