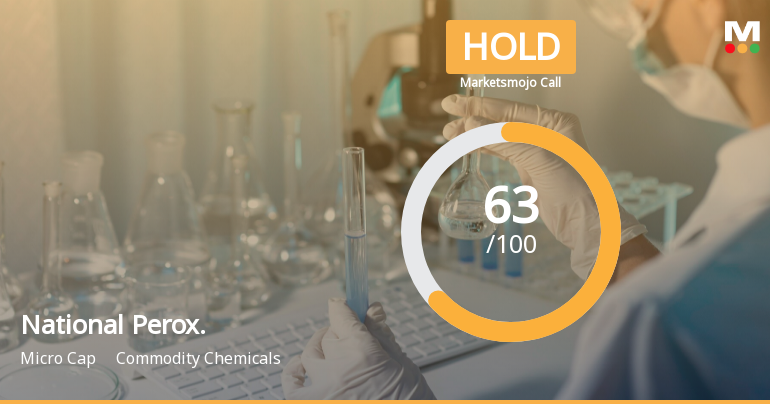
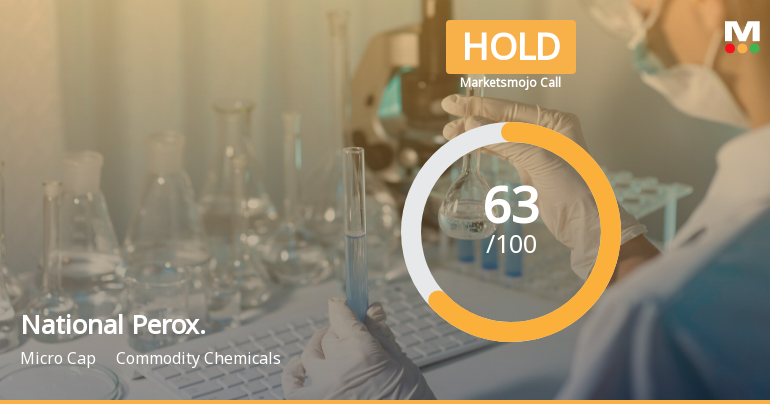
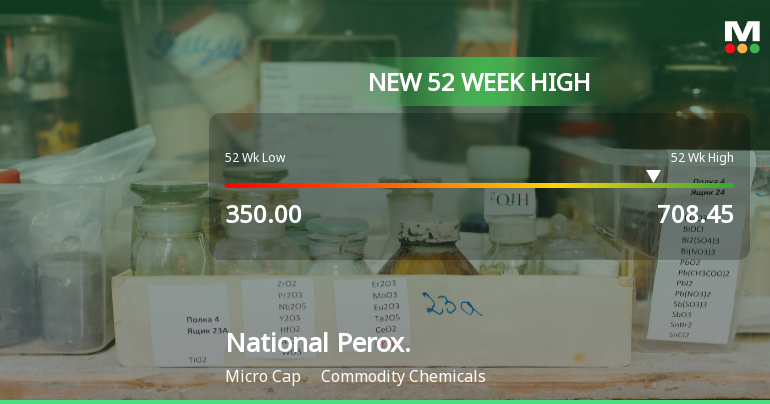
National Perox.

  • Market Cap: Micro Cap
  • Industry: Commodity Chemicals
  • ISIN: INE0PO601011
  • NSEID:
  • BSEID: 544205
INR
625.00
-10.3 (-1.62%)
BSENSE

Sep 01, 03:30 PM

BSE+NSE Vol: 352

  • Price Points
  • Score
  • Mojo Parameters
  • Total Return
  • News and Corporate Actions
  • Key factors
  • Shareholding
  • Financials
  • CompanyCV
stock-summaryPrice Point
High/Low

1Day

52 Week

Valuation
Technical
Day's Volume

CASH

352.0 (-59.70%) Volume

Shareholding (Jun 2026)

FII

0.00%

Held by 0 FIIs

DII

0.01%

Held by 0 DIIs

Promoter

70.76%

Why is National Peroxide Ltd falling/rising?

02-Sep-2026

As of 01-Sep, National Peroxide Ltd's stock price is falling, currently at 625.00, reflecting a decrease of 10.3 or 1.62%. The stock has declined for three consecutive days, underperformed its sector, and experienced reduced investor interest, despite positive financial results in recent quarters.

As of 01-Sep, National Peroxide Ltd's stock price is falling, currently at 625.00, reflecting a decrease of 10.3 or 1.62%. This decline is part of a broader trend, as the stock has been losing value for the last three days, with a total drop of 3.69% during this period. Additionally, the stock underperformed its sector by 1.2% today, indicating weaker performance compared to its peers.<BR><BR>Investor participation has also decreased, with delivery volume falling by 45.58% against the five-day average, suggesting reduced interest from investors. The stock touched an intraday low of Rs 610, which is a significant drop of 3.98%. Although the stock is trading above its longer-term moving averages (20-day, 50-day, 100-day, and 200-day), it is below the 5-day moving average, which may indicate short-term weakness.<BR><BR>Despite these negative indicators, the company has shown positive financial results in recent quarters, including a 12.13% growth in net sales and substantial increases in profit before tax and profit after tax. However, these positive results have not been enough to counteract the current downward pressure on the stock price. Overall, the combination of recent price declines, reduced investor participation, and underperformance relative to the sector contributes to the current falling trend of National Peroxide Ltd's stock.

View full answer

What does National Perox. do?

01-Sep-2026

National Peroxide Ltd is a micro-cap company in the commodity chemicals industry, reporting net sales of 96 Cr and a net profit of 7 Cr for June 2026. It has a market cap of INR 372 Cr, a P/E ratio of 20.00, and a return on equity of 5.15%.

Overview: <BR>National Peroxide Ltd operates in the commodity chemicals industry and is classified as a micro-cap company.<BR><BR>History: <BR>The company was incorporated in 2020 as NPL Chemicals Limited and underwent a name change to National Peroxide Limited following a Composite Scheme of Arrangement. The latest quarterly results reported net sales and net profit for June 2026.<BR><BR>Financial Snapshot: <BR>Net Sales: 96 Cr (Quarterly Results - Jun 2026) <BR>Net Profit: 7 Cr (Quarterly Results - Jun 2026) <BR>Market Cap: INR 372 Cr (Micro Cap)<BR><BR>Key Metrics: <BR>P/E: 20.00 <BR>Industry P/E: 43 <BR>Dividend Yield: 0.00% <BR>Debt-Equity: -0.16 <BR>Return on Equity: 5.15% <BR>Price to Book: 1.04 <BR><BR>Contact Details: <BR>Registrar Address: Not available. <BR>Phone: N/A <BR>Email: N/A <BR>Website: N/A

View full answer

Who are the peers of the National Perox.?

01-Sep-2026

National Perox.'s peers include Chemfab Alka., Primo Chemicals, POCL Enterprises, Mangalam Organic, Lords Chloro, Alufluoride, Andhra Petrochem, Genus Prime, and Hind.Organ.Chem. In terms of management risk, National Perox. and Genus Prime are rated Below Average, while Alufluoride is rated Excellent; National Perox. has a 1-year return of 3.93%, higher than Chemfab Alka.'s -44.94% but lower than Genus Prime's 72.28%.

Peers: The peers of National Perox. are Chemfab Alka., Primo Chemicals, POCL Enterprises, Mangalam Organic, Lords Chloro, Alufluoride, Andhra Petrochem, Genus Prime, and Hind.Organ.Chem.<BR><BR>Quality Snapshot: Excellent management risk is observed at Alufluoride, while Average management risk is found at Chemfab Alka., Primo Chemicals, POCL Enterprises, Mangalam Organic, Lords Chloro, and Andhra Petrochem, and the rest. Below Average management risk is noted for National Perox., Genus Prime, and Hind.Organ.Chem. Growth is Excellent at POCL Enterprises, Good at Lords Chloro and Alufluoride, Below Average at Chemfab Alka., Primo Chemicals, Mangalam Organic, and Andhra Petrochem, and the rest. National Perox. and Hind.Organ.Chem. have Below Average growth, while Genus Prime shows Good growth. Capital Structure is Excellent at National Perox., Good at Alufluoride and Andhra Petrochem, Average at Primo Chemicals, and Below Average at Chemfab Alka., POCL Enterprises, Mangalam Organic, Genus Prime, and Hind.Organ.Chem.<BR><BR>Return Snapshot: Genus Prime has the highest 1-year return at 72.28%, while Chemfab Alka. has the lowest at -44.94%. National Perox.'s 1-year return of 3.93% is higher than Chemfab Alka. but lower than Genus Prime. Additionally, the peers with negative six-month returns include Chemfab Alka., POCL Enterprises, and Mangalam Organic.

View full answer

How big is National Perox.?

01-Sep-2026

As of 31st August, National Peroxide Ltd has a market capitalization of 372.00 Cr, with recent net sales of 319.13 Cr and a net profit of 18.06 Cr. Shareholder's funds are 349.26 Cr and total assets amount to 441.72 Cr as of March 2025.

As of 31st August, National Peroxide Ltd has a market capitalization of 372.00 Cr, categorizing it as a Micro Cap company.<BR><BR>In the latest four quarters, National Peroxide reported Net Sales of 319.13 Cr and a Net Profit of 18.06 Cr.<BR><BR>The latest annual period for the balance sheet is March 2025, with Shareholder's Funds amounting to 349.26 Cr and Total Assets of 441.72 Cr.

View full answer

Which are the latest news on National Perox.?

01-Sep-2026

Should I buy, sell or hold National Peroxide Ltd?

14-Aug-2026

When is the next results date for National Peroxide Ltd?

30-Jul-2026

The next results date for National Peroxide Ltd is August 3, 2026.

The next results date for National Peroxide Ltd is scheduled for August 3, 2026.

View full answer

Are National Peroxide Ltd latest results good or bad?

06-Feb-2026

National Peroxide Ltd's latest Q3 FY26 results show a significant net profit increase of 369.23% quarter-on-quarter and improved revenue, but concerns remain due to a history of losses, low return on equity, and a 40.21% decline in stock value over the past year, indicating mixed overall performance. Caution is advised regarding the company's future prospects.

National Peroxide Ltd's latest results for Q3 FY26 present a mixed picture. On one hand, the company reported a net profit of ₹1.83 crore, which is a significant improvement of 369.23% quarter-on-quarter. Additionally, revenue increased by 1.17% from the previous quarter, reaching ₹69.09 crore, and this marks an 11.15% increase year-on-year.<BR><BR>The operating margin also improved to 10.12%, the highest in seven quarters, suggesting some operational stability. However, this recovery comes after a challenging FY25, where the company faced a net loss of ₹2 crore on revenues of ₹286 crore, indicating a significant decline from a profit of ₹16 crore in FY24.<BR><BR>Despite these positive indicators, the overall financial health of National Peroxide remains concerning. The company has struggled with volatile margins, and its return on equity (ROE) is alarmingly low at 1.90%, with the latest quarterly ROE even dipping to -1.92%. The stock has underperformed significantly, with a one-year decline of 40.21%, contrasting sharply with the broader market's performance.<BR><BR>In summary, while there are some signs of recovery in the most recent quarter, the underlying issues, including poor historical performance and low investor confidence, suggest that the results are not entirely positive. Caution is warranted when assessing the company's future prospects.

View full answer

How has been the historical performance of National Perox.?

03-Nov-2025

National Perox has experienced a significant decline in financial performance over the past three years, with net sales dropping from 375.87 Cr in March 2023 to 286.87 Cr in March 2025, resulting in a loss of -2.25 Cr in profit after tax. Key metrics such as operating profit and earnings per share also fell sharply, indicating reduced profitability and cash generation capabilities.

Answer:<BR>The historical performance of National Perox shows a decline in key financial metrics over the past three years, culminating in a loss for the year ending March 2025.<BR><BR>Breakdown:<BR>National Perox's net sales decreased from 375.87 Cr in March 2023 to 286.87 Cr in March 2025, reflecting a downward trend in total operating income, which also fell from 375.87 Cr to 286.87 Cr during the same period. The company's total expenditure, excluding depreciation, decreased from 317.36 Cr in March 2023 to 271.66 Cr in March 2025, primarily due to a reduction in raw material costs from 191.26 Cr to 145.46 Cr. However, operating profit (PBDIT) declined significantly from 67.36 Cr in March 2023 to 19.70 Cr in March 2025, leading to a profit before tax of -2.08 Cr in March 2025, down from 53.50 Cr in March 2023. Consequently, profit after tax also turned negative, reaching -2.25 Cr in March 2025 compared to 39.50 Cr in March 2023. The company's earnings per share (EPS) reflected this downturn, dropping from 68.7 in March 2023 to -3.91 in March 2025. On the balance sheet, total liabilities decreased from 453.55 Cr in March 2023 to 441.72 Cr in March 2025, while total assets also fell from 453.55 Cr to 441.72 Cr. Cash flow from operating activities showed a decline from 67.00 Cr in March 2023 to 18.00 Cr in March 2025, indicating a significant reduction in cash generation capabilities. Overall, National Perox's financial performance has deteriorated over the past three years, resulting in losses and reduced profitability.

View full answer

Who are the top shareholders of the National Perox.?

17-Jul-2025

The top shareholders of National Perox include Nowrosjee Wadia And Sons Limited with 30.78% and individual investors with 24.82%. There are no mutual funds or foreign institutional investors holding shares in the company.

The top shareholders of National Perox include the promoters, with Nowrosjee Wadia And Sons Limited holding the largest stake at 30.78%. Additionally, individual investors collectively hold 24.82% of the shares. There are currently no mutual funds or foreign institutional investors (FIIs) holding shares in the company.

View full answer

Is National Perox. overvalued or undervalued?

09-Jun-2025

As of May 7, 2025, National Perox. is considered overvalued and risky, with a PE ratio of -157.63 and negative EV ratios, indicating poor financial performance compared to peers like Solar Industries and Godrej Industries, despite a recent stock return of 8.61%.

As of 7 May 2025, the valuation grade for National Perox. has moved from attractive to risky, indicating a significant shift in its financial outlook. The company is currently considered overvalued. Key ratios highlight this concern: the PE ratio stands at an alarming -157.63, while the EV to EBIT ratio is also negative at -64.72, and the EV to EBITDA ratio is at 20.91. These figures suggest that the company is struggling to generate profits relative to its valuation.<BR><BR>In comparison to its peers, National Perox. shows stark contrasts. For instance, Solar Industries India Ltd. has a PE ratio of 123.77, while Godrej Industries Ltd. boasts a PE ratio of 46.63, both indicating much stronger valuations. Additionally, National Perox.'s ROE is at -0.63%, further emphasizing its underperformance relative to the industry. Despite a recent stock return of 8.61% over the past week, which outperformed the Sensex's 1.35%, the overall financial metrics suggest that investors should approach National Perox. with caution.

View full answer

What is the technical trend for National Perox.?

09-Jun-2025

As of June 6, 2025, National Perox's technical trend has shifted to a moderate bearish stance, indicated by daily moving averages and weekly KST readings, despite some mixed signals from the Dow Theory and weekly MACD.

As of 6 June 2025, the technical trend for National Perox has changed from mildly bearish to bearish. The current stance is bearish with a moderate strength. Key indicators include the daily moving averages showing a mildly bearish trend, while the weekly KST is bearish. The Dow Theory indicates a mildly bullish stance on the weekly but remains bearish on the monthly, suggesting mixed signals. The MACD on the weekly is mildly bullish, but the overall sentiment leans bearish due to the prevailing moving averages and KST readings.

View full answer

Has National Perox. declared dividend?

06-Jun-2025

Yes, National Peroxide Ltd has declared a 125% dividend, amounting to ₹12.5 per share, with an ex-date of August 20, 2024. However, the company's total returns have been negative in the last 6 months and stagnant over the past several years.

National Peroxide Ltd has declared a 125% dividend.<BR><BR>Dividend Details:<BR>- Percentage announced: 125%<BR>- Amount per share: 12.5<BR>- Ex-date: 20 Aug 24<BR><BR>Dividend Yield: 2.05%.<BR><BR>Total Returns by Period:<BR>In the last 6 months, the price return was -30.82%, the dividend return was 0%, resulting in a total return of -30.82%.<BR><BR>Over the past year, there was no price return, no dividend return, leading to a total return of 0.0%.<BR><BR>In the 2-year period, the price return remained at 0%, with no dividend return, resulting in a total return of 0.0%.<BR><BR>For the 3-year period, the price return was 0%, with no dividend return, resulting in a total return of 0.0%.<BR><BR>In the 4-year period, there was a price return of 0%, no dividend return, leading to a total return of 0.0%.<BR><BR>Finally, in the 5-year period, the price return was 0%, with no dividend return, resulting in a total return of 0.0%.<BR><BR>Overall, while National Peroxide Ltd has declared a significant dividend, the total returns over various periods indicate a challenging performance, particularly in the short term with a notable decline in price return.

View full answer
iScoreScore
Click here to find our call on this stock
Strong Sell
Sell
Hold
Buy
Strong Buy

Dashboard

1

Weak Long Term Fundamental Strength with a -1.79% CAGR growth in Operating Profits over the last 5 years

  • The company has been able to generate a Return on Equity (avg) of 2.75% signifying low profitability per unit of shareholders funds
2

With a growth in Net Sales of 12.13%, the company declared Very Positive results in Jun 26

3

With ROE of 5.1, it has a Attractive valuation with a 1 Price to Book Value

4

Majority shareholders : Promoters

 
stock-summaryMojo Parameters

Mojo Parameters

Loading Valuation Snapshot...

Stock DNA

stock-summary
Industry

Commodity Chemicals

stock-summary
Market cap

INR 365 Cr (Micro Cap)

stock-summary
P/E

19.00

stock-summary
Industry P/E

43

stock-summary
Dividend Yield

0.00%

stock-summary
Debt Equity

-0.16

stock-summary
Return on Equity

5.15%

stock-summary
Price to Book

1.01

Revenue and Profits:
Net Sales:
96 Cr
(Quarterly Results - Jun 2026)
Net Profit:
7 Cr
stock-summaryTotal Returns
Total Returns (Price + Dividend) stock-summary
Dividend Yield (0%)
TimePeriod
Price Return
Dividend Return
Total Return
3 Months
10.89%
1.22%
12.11%
6 Months
48.35%
1.68%
50.03%
1 Year
2.5%
1.15%
3.65%
2 Years
-39.22%
0.62%
-38.6%
3 Years
0%
0%
0.0%
4 Years
0%
0%
0.0%
5 Years
0%
0%
0.0%

Latest dividend: 12.5 per share ex-dividend date: Aug-20-2024

Risk Adjusted Returns v/s stock-summary
Returns Beta
Icon
Beta has not been calculated since enough price history is not available
stock-summaryNews & Corporate Actions

Announcements stock-summary

Announcement under Regulation 30 (LODR)-Newspaper Publication

13-Aug-2026 | Source : BSE

Please find attached Copies of Newpaper Publication of the Extract of the Revised Audited Financial Results for the Quarter & year ended March 31 2026 and Unaudited Financial results for the Quarter ended June 30 2026.

Fixation Of Annual General Meeting Of The Company

12-Aug-2026 | Source : BSE

Please find attached herewith details of Annual general Meeting of the Company.

Unaudited Financial Results For The Quarter Ended June 302026

12-Aug-2026 | Source : BSE

Please find attached herewith unaudited financial results for quarter ended June 30 2026

Corporate Actions stock-summary

stock-summary
BOARD MEETING

No Upcoming Board Meetings

stock-summary
DIVIDEND

National Peroxide Ltd has declared 70% dividend, ex-date: 22 Sep 26

stock-summary
SPLITS

No Splits history available

stock-summary
BONUS

No Bonus history available

stock-summary
RIGHTS

No Rights history available

stock-summaryKey Factors

Quality key factors stock-summary

Factor
Value
Sales Growth (5y)
-1.28%
EBIT Growth (5y)
-1.79%
EBIT to Interest (avg)
5.65
Debt to EBITDA (avg)
0.85
Net Debt to Equity (avg)
-0.16
Sales to Capital Employed (avg)
0.71
Tax Ratio
17.58%
Dividend Payout Ratio
0
Pledged Shares
0
Institutional Holding
0.01%
ROCE (avg)
2.08%
ROE (avg)
2.75%

Valuation key factors

Factor
Value
P/E Ratio
19
Industry P/E
43
Price to Book Value
0.99
EV to EBIT
16.96
EV to EBITDA
7.76
EV to Capital Employed
0.99
EV to Sales
0.94
PEG Ratio
0.05
Dividend Yield
NA
ROCE (Latest)
3.44%
ROE (Latest)
5.15%

Technicals key factors

Indicator
Weekly
Monthly
MACD
Bullish
RSI
No Signal
No Signal
Bollinger Bands
Mildly Bullish
Sideways
Moving Averages
Bullish (Daily)
KST
Mildly Bearish
Dow Theory
No Trend
No Trend
stock-summary Technical Indicator Scale: Bearish, Mildly Bearish, Sideways, Mildly Bullish, Bullish  Turned 
stock-summaryShareholding
Shareholding Snapshot : Jun 2026stock-summary
Shareholding Compare (%holding) stock-summary
Majority shareholders

Promoters

Pledged Promoter Holdings

None

Mutual Funds

Held by 0 Schemes

FIIs

Held by 0 FIIs

Promoter with highest holding

Nowrosjee Wadia And Sons Limited (33.08%)

Highest Public shareholder

None

Individual Investors Holdings

24.82%

stock-summaryFinancial
[
  {
    "link": "quarterly",
    "btn_text": "All Quarterly Results",
    "header": "Quarterly Results Snapshot (Standalone) - Jun'26 - QoQ",
    "rhs": [
      {
        "prefix": "Net Sales ",
        "suffix": "QoQ Growth in quarter ended Jun 2026 is 12.13% vs 24.01% in Mar 2026",
        "dir": -1
      },
      {
        "prefix": "Standalone Net Profit ",
        "suffix": "QoQ Growth in quarter ended Jun 2026 is -28.39% vs 404.37% in Mar 2026",
        "dir": -1
      }
    ],
    "table": {
      "header": [
        "Jun'26",
        "Mar'26",
        "Change(%)"
      ],
      "body": [
        {
          "field": "Net Sales",
          "val1": "96.07",
          "val2": "85.68",
          "chgp": "12.13%",
          "chgp_class": "positive"
        },
        {
          "field": "Operating Profit (PBDIT) excl Other Income",
          "val1": "12.24",
          "val2": "14.88",
          "chgp": "-17.74%",
          "chgp_class": "negative"
        },
        {
          "field": "Interest",
          "val1": "0.26",
          "val2": "0.32",
          "chgp": "-18.75%",
          "chgp_class": "positive"
        },
        {
          "field": "Exceptional Items",
          "val1": "0.00",
          "val2": "0.00",
          "chgp": "",
          "chgp_class": "neutral"
        },
        {
          "field": "Standalone Net Profit",
          "val1": "6.61",
          "val2": "9.23",
          "chgp": "-28.39%",
          "chgp_class": "negative"
        },
        {
          "field": "Operating Profit Margin (Excl OI)",
          "val1": "12.74%",
          "val2": "17.37%",
          "chgp": "-4.63%",
          "chgp_class": "negative"
        }
      ]
    }
  },
  {
    "link": "half-yearly",
    "btn_text": "All Half Yearly Results",
    "header": "Half Yearly Results Snapshot (Standalone) - Sep'25",
    "rhs": [
      {
        "prefix": "Net Sales ",
        "suffix": " Growth in half year ended Sep 2025 is -10.64% vs -6.39% in Sep 2024",
        "dir": -1
      },
      {
        "prefix": "Standalone Net Profit ",
        "suffix": " Growth in half year ended Sep 2025 is -77.78% vs -35.64% in Sep 2024",
        "dir": -1
      }
    ],
    "table": {
      "header": [
        "Sep'25",
        "Sep'24",
        "Change(%)"
      ],
      "body": [
        {
          "field": "Net Sales",
          "val1": "134.94",
          "val2": "151.01",
          "chgp": "-10.64%",
          "chgp_class": "negative"
        },
        {
          "field": "Operating Profit (PBDIT) excl Other Income",
          "val1": "9.32",
          "val2": "14.33",
          "chgp": "-34.96%",
          "chgp_class": "negative"
        },
        {
          "field": "Interest",
          "val1": "0.71",
          "val2": "0.88",
          "chgp": "-19.32%",
          "chgp_class": "positive"
        },
        {
          "field": "Exceptional Items",
          "val1": "0.00",
          "val2": "0.00",
          "chgp": "",
          "chgp_class": "neutral"
        },
        {
          "field": "Standalone Net Profit",
          "val1": "1.28",
          "val2": "5.76",
          "chgp": "-77.78%",
          "chgp_class": "negative"
        },
        {
          "field": "Operating Profit Margin (Excl OI)",
          "val1": "6.91%",
          "val2": "9.49%",
          "chgp": "-2.58%",
          "chgp_class": "negative"
        }
      ]
    }
  },
  {
    "link": "nine-monthly",
    "btn_text": "All Nine Monthly Results",
    "header": "Nine Monthly Results Snapshot (Standalone) - Dec'25",
    "rhs": [
      {
        "prefix": "Net Sales ",
        "suffix": "YoY Growth in nine months ended Dec 2025 is -4.29% vs -12.97% in Dec 2024",
        "dir": 1
      },
      {
        "prefix": "Standalone Net Profit ",
        "suffix": "YoY Growth in nine months ended Dec 2025 is -26.65% vs -69.10% in Dec 2024",
        "dir": 1
      }
    ],
    "table": {
      "header": [
        "Dec'25",
        "Dec'24",
        "Change(%)"
      ],
      "body": [
        {
          "field": "Net Sales",
          "val1": "204.03",
          "val2": "213.17",
          "chgp": "-4.29%",
          "chgp_class": "negative"
        },
        {
          "field": "Operating Profit (PBDIT) excl Other Income",
          "val1": "16.31",
          "val2": "17.55",
          "chgp": "-7.07%",
          "chgp_class": "negative"
        },
        {
          "field": "Interest",
          "val1": "1.03",
          "val2": "1.28",
          "chgp": "-19.53%",
          "chgp_class": "positive"
        },
        {
          "field": "Exceptional Items",
          "val1": "-0.58",
          "val2": "0.00",
          "chgp": "",
          "chgp_class": "neutral"
        },
        {
          "field": "Standalone Net Profit",
          "val1": "3.11",
          "val2": "4.24",
          "chgp": "-26.65%",
          "chgp_class": "negative"
        },
        {
          "field": "Operating Profit Margin (Excl OI)",
          "val1": "7.99%",
          "val2": "8.23%",
          "chgp": "-0.24%",
          "chgp_class": "negative"
        }
      ]
    }
  },
  {
    "link": "annual",
    "btn_text": "All Annual Results",
    "header": "Annual Results Snapshot (Standalone) - Mar'26",
    "rhs": [
      {
        "prefix": "Net Sales ",
        "suffix": "YoY Growth in year ended Mar 2026 is 0.99% vs -13.85% in Mar 2025",
        "dir": 1
      },
      {
        "prefix": "Standalone Net Profit ",
        "suffix": "YoY Growth in year ended Mar 2026 is 358.67% vs -113.40% in Mar 2025",
        "dir": 1
      }
    ],
    "table": {
      "header": [
        "Mar'26",
        "Mar'25",
        "Change(%)"
      ],
      "body": [
        {
          "field": "Net Sales",
          "val1": "289.71",
          "val2": "286.87",
          "chgp": "0.99%",
          "chgp_class": "positive"
        },
        {
          "field": "Operating Profit (PBDIT) excl Other Income",
          "val1": "24.24",
          "val2": "15.21",
          "chgp": "59.37%",
          "chgp_class": "positive"
        },
        {
          "field": "Interest",
          "val1": "1.36",
          "val2": "1.67",
          "chgp": "-18.56%",
          "chgp_class": "positive"
        },
        {
          "field": "Exceptional Items",
          "val1": "-0.58",
          "val2": "0.00",
          "chgp": "",
          "chgp_class": "neutral"
        },
        {
          "field": "Standalone Net Profit",
          "val1": "5.82",
          "val2": "-2.25",
          "chgp": "358.67%",
          "chgp_class": "positive"
        },
        {
          "field": "Operating Profit Margin (Excl OI)",
          "val1": "8.37%",
          "val2": "5.30%",
          "chgp": "3.07%",
          "chgp_class": "positive"
        }
      ]
    }
  }
]

Quarterly Results Snapshot (Standalone) - Jun'26 - QoQstock-summary

Jun'26
Mar'26
Change(%)
Net Sales
96.07
85.68
12.13%
Operating Profit (PBDIT) excl Other Income
12.24
14.88
-17.74%
Interest
0.26
0.32
-18.75%
Exceptional Items
0.00
0.00
Standalone Net Profit
6.61
9.23
-28.39%
Operating Profit Margin (Excl OI)
12.74%
17.37%
-4.63%
Values in Rs Cr.
Direction Arrows
Net Sales

QoQ Growth in quarter ended Jun 2026 is 12.13% vs 24.01% in Mar 2026

Direction Arrows
Standalone Net Profit

QoQ Growth in quarter ended Jun 2026 is -28.39% vs 404.37% in Mar 2026

Half Yearly Results Snapshot (Standalone) - Sep'25stock-summary

Sep'25
Sep'24
Change(%)
Net Sales
134.94
151.01
-10.64%
Operating Profit (PBDIT) excl Other Income
9.32
14.33
-34.96%
Interest
0.71
0.88
-19.32%
Exceptional Items
0.00
0.00
Standalone Net Profit
1.28
5.76
-77.78%
Operating Profit Margin (Excl OI)
6.91%
9.49%
-2.58%
Values in Rs Cr.
Direction Arrows
Net Sales

Growth in half year ended Sep 2025 is -10.64% vs -6.39% in Sep 2024

Direction Arrows
Standalone Net Profit

Growth in half year ended Sep 2025 is -77.78% vs -35.64% in Sep 2024

Nine Monthly Results Snapshot (Standalone) - Dec'25stock-summary

Dec'25
Dec'24
Change(%)
Net Sales
204.03
213.17
-4.29%
Operating Profit (PBDIT) excl Other Income
16.31
17.55
-7.07%
Interest
1.03
1.28
-19.53%
Exceptional Items
-0.58
0.00
Standalone Net Profit
3.11
4.24
-26.65%
Operating Profit Margin (Excl OI)
7.99%
8.23%
-0.24%
Values in Rs Cr.
Direction Arrows
Net Sales

YoY Growth in nine months ended Dec 2025 is -4.29% vs -12.97% in Dec 2024

Direction Arrows
Standalone Net Profit

YoY Growth in nine months ended Dec 2025 is -26.65% vs -69.10% in Dec 2024

Annual Results Snapshot (Standalone) - Mar'26stock-summary

Mar'26
Mar'25
Change(%)
Net Sales
289.71
286.87
0.99%
Operating Profit (PBDIT) excl Other Income
24.24
15.21
59.37%
Interest
1.36
1.67
-18.56%
Exceptional Items
-0.58
0.00
Standalone Net Profit
5.82
-2.25
358.67%
Operating Profit Margin (Excl OI)
8.37%
5.30%
3.07%
Values in Rs Cr.
Direction Arrows
Net Sales

YoY Growth in year ended Mar 2026 is 0.99% vs -13.85% in Mar 2025

Direction Arrows
Standalone Net Profit

YoY Growth in year ended Mar 2026 is 358.67% vs -113.40% in Mar 2025

stock-summaryCompany CV
About National Peroxide Ltd stock-summary
stock-summary
National Peroxide Ltd
Micro Cap
Commodity Chemicals
National Peroxide Limited was formerly incorporated as NPL Chemicals Limited on July 29, 2020, as a Public Limited Company pursuant to a Certificate of Incorporation dated August 5, 2020, issued by the Registrar of Companies, Maharashtra at Mumbai. Through the Composite Scheme of Arrangement, the name of the Company has been changed to National Peroxide Limited and a fresh Certificate of Incorporation dated January 31, 2024, was issued by the Registrar of Companies, Maharashtra at Mumbai.
Company Coordinates stock-summary
Icon
No Company Details Available