
Compare Navios Maritime Partners LP with Similar Stocks
Dashboard
Poor Management Efficiency with a low ROCE of 9.04%
- The company has been able to generate a Return on Capital Employed (avg) of 9.04% signifying low profitability per unit of total capital (equity and debt)
Healthy long term growth as Net Sales has grown by an annual rate of 43.05% and Operating profit at 56.55%
Negative results in Jun 25
With ROCE of 8.69%, it has a attractive valuation with a 0.60 Enterprise value to Capital Employed
High Institutional Holdings at 33.58%
Total Returns (Price + Dividend) 
Navios Maritime Partners LP for the last several years.
Risk Adjusted Returns v/s
News
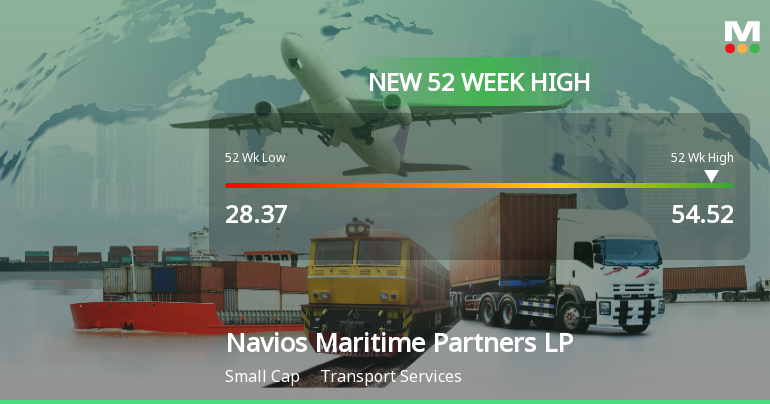
Navios Maritime Partners LP Hits New 52-Week High of $54.52
Navios Maritime Partners LP achieved a new 52-week high of USD 54.52 on November 17, 2025, reflecting a significant increase from its previous low. The company, with a market cap of approximately USD 1,436 million, demonstrates effective management and financial stability within the transport services industry.
Read full news article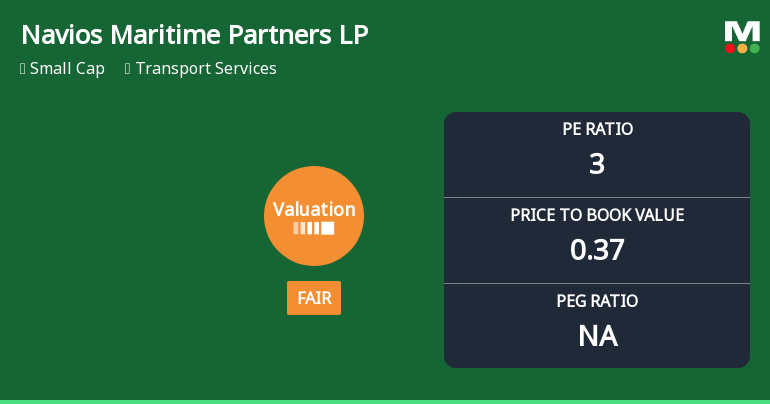
Navios Maritime Partners LP Experiences Revision in Stock Evaluation Amid Competitive Landscape
Navios Maritime Partners LP has recently adjusted its valuation, showcasing a P/E ratio of 3 and a price-to-book value of 0.37. Its financial metrics, including EV to EBIT and EV to EBITDA ratios, highlight its distinct positioning within the transport services industry compared to peers.
Read full news article Announcements

Corporate Actions
Quality key factors
Valuation key factors
Technicals key factors
 Technical Indicator Scale: Bearish, Mildly Bearish, Sideways, Mildly Bullish, Bullish Turned
 Shareholding Snapshot : Sep 2025
Shareholding Compare (%holding)
Foreign Institutions
Held in 5 Schemes (0.4%)
Held by 15 Foreign Institutions (2.59%)
Quarterly Results Snapshot (Consolidated) - Jun'25 - QoQ

QoQ Growth in quarter ended Jun 2025 is 16.09% vs -3.73% in Mar 2025
QoQ Growth in quarter ended Jun 2025 is 80.64% vs -53.64% in Mar 2025
Annual Results Snapshot (Consolidated) - Dec'24

YoY Growth in year ended Dec 2024 is 2.08% vs 7.96% in Dec 2023
YoY Growth in year ended Dec 2024 is -15.29% vs -25.14% in Dec 2023
About Navios Maritime Partners LP

Company Coordinates


