
Compare NBI Indl. Fin. with Similar Stocks
Dashboard
Weak Long Term Fundamental Strength with an average Return on Equity (ROE) of 0.33%
With ROE of 0.5, it has a Expensive valuation with a 0.2 Price to Book Value
Despite the size of the company, domestic mutual funds hold only 0% of the company
Below par performance in long term as well as near term
Stock DNA
Non Banking Financial Company (NBFC)
INR 645 Cr (Micro Cap)
39.00
21
0.02%
0.00
0.47%
0.25
Total Returns (Price + Dividend) 
Latest dividend: 0.5 per share ex-dividend date: Aug-14-2025
Risk Adjusted Returns v/s
Returns Beta

News

NBI Industrial Finance Company Ltd is Rated Strong Sell
NBI Industrial Finance Company Ltd is rated Strong Sell by MarketsMOJO. This rating was last updated on 10 July 2026, reflecting a change in the company’s assessment. However, all fundamentals, returns, and financial metrics discussed here are current as of 13 July 2026, providing investors with the latest view of the stock’s position.
Read full news article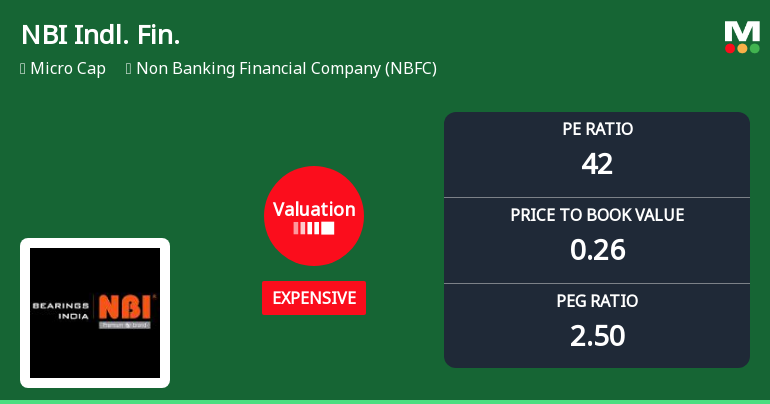
NBI Industrial Finance Company Ltd: Valuation Shifts Signal Price Attractiveness Concerns
NBI Industrial Finance Company Ltd has witnessed a significant re-rating in its valuation parameters, moving from fair to expensive territory, even as its share price surged nearly 20% in a single day. This shift has prompted a reassessment of the stock’s price attractiveness, especially when compared with its historical averages and peer group valuations within the Non Banking Financial Company (NBFC) sector.
Read full news article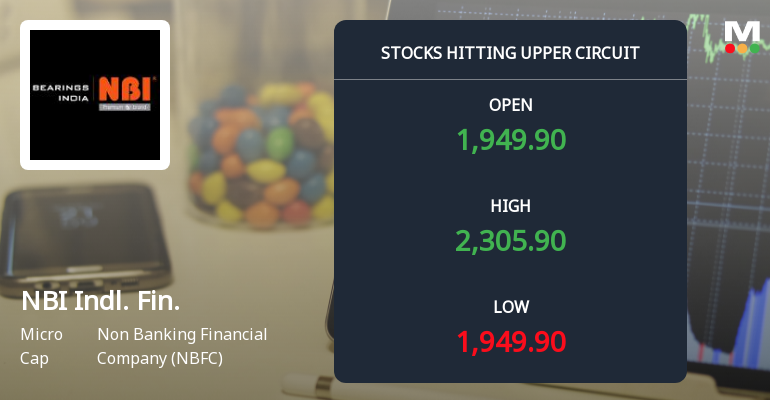
NBI Industrial Finance Company Ltd Locks at Upper Circuit With 18.13% Gain — Buyers Queue, Sellers Absent
At Rs 2,255.9, the buying was done — not because demand dried up, but because the exchange wouldn't let the stock go any higher. NBI Industrial Finance Company Ltd locked at its upper circuit of 20% on 09 Jul 2026, with buyers queuing and no sellers willing to part with shares.
Read full news article Announcements
Financial Result Updates
17-Sep-2019 | Source : NSE
| N. B. I. Industrial Finance Company Limited has submitted to the Exchange, the financial results for the period ended June 30, 2019. |
Reasons for Delayed\/Non-submission of Financial Results
03-Sep-2019 | Source : NSE
| N. B. I. Industrial Finance Company Limited has informed the Exchange that NSE mail ref : NSE/LIST/FR/89160IND ?? AS have become applicable to the Company w.e.f. 1st quarter of FY 2019-20. The Company has notified NSE that quarterly results for quarter ended 30th June 2019 would be submitted by 14th September i.e. within one month of the due date in accordance with SEBI Circular No. CIR/CFD/FAC/62/2016 dated July 05, 2016 after approval of our Board. NSE has been notified of deferment of submission of the results vide Notice dated 13.08.2019 filed in NEAPS App. No. 2019/Aug/4404/4562Thanks,Team NBI |
Trading Window
03-Aug-2019 | Source : NSE
| N. B. I. Industrial Finance Company Limited has informed the Exchange regarding the Trading Window closure pursuant to SEBI (Prohibition of Insider Trading) Regulations, 2015 |
Corporate Actions

No Upcoming Board Meetings

NBI Industrial Finance Company Ltd has declared 10% dividend, ex-date: 14 Aug 25

NBI Industrial Finance Company Ltd has announced 5:10 stock split, ex-date: 07 Dec 17

No Bonus history available

No Rights history available
Quality key factors
Valuation key factors
Technicals key factors
 Technical Indicator Scale: Bearish, Mildly Bearish, Sideways, Mildly Bullish, Bullish Turned
 Shareholding Snapshot : Mar 2026
Shareholding Compare (%holding)
Promoters
None
Held by 0 Schemes
Held by 1 FIIs (0.17%)
Shree Capital Services Ltd (21.0%)
Jindal India Power Limited (4.39%)
6.08%
Quarterly Results Snapshot (Standalone) - Mar'26 - YoY

YoY Growth in quarter ended Mar 2026 is -78.09% vs -25.06% in Mar 2025
YoY Growth in quarter ended Mar 2026 is -93.52% vs -28.39% in Mar 2025
Half Yearly Results Snapshot (Standalone) - Sep'25

Growth in half year ended Sep 2025 is 54.55% vs -6.57% in Sep 2024
Growth in half year ended Sep 2025 is 75.85% vs -16.97% in Sep 2024
Nine Monthly Results Snapshot (Standalone) - Dec'25
YoY Growth in nine months ended Dec 2025 is 187.29% vs -13.31% in Dec 2024
YoY Growth in nine months ended Dec 2025 is 240.90% vs -18.12% in Dec 2024
Annual Results Snapshot (Standalone) - Mar'26
YoY Growth in year ended Mar 2026 is 42.57% vs -18.44% in Mar 2025
YoY Growth in year ended Mar 2026 is 46.41% vs -23.17% in Mar 2025
About NBI Industrial Finance Company Ltd

Company Coordinates


