
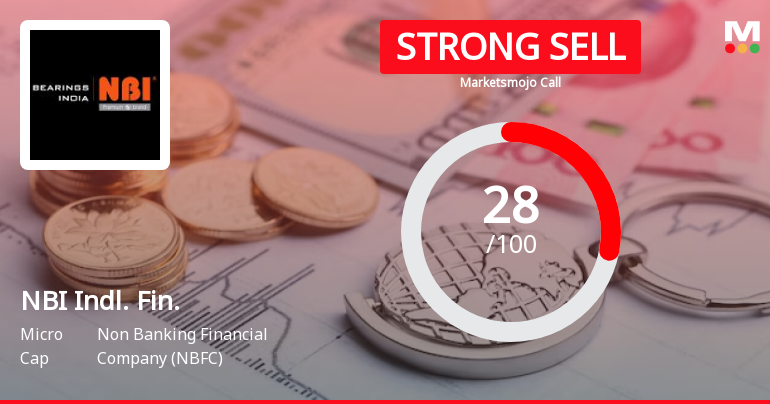
NBI Industrial Finance Company Ltd is Rated Strong Sell
2026-07-13 10:11:00NBI Industrial Finance Company Ltd is rated Strong Sell by MarketsMOJO. This rating was last updated on 10 July 2026, reflecting a change in the company’s assessment. However, all fundamentals, returns, and financial metrics discussed here are current as of 13 July 2026, providing investors with the latest view of the stock’s position.
Read full news article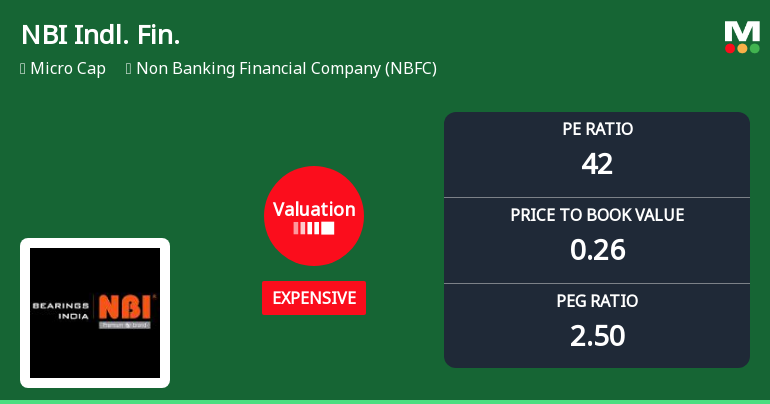
NBI Industrial Finance Company Ltd: Valuation Shifts Signal Price Attractiveness Concerns
2026-07-13 08:00:37NBI Industrial Finance Company Ltd has witnessed a significant re-rating in its valuation parameters, moving from fair to expensive territory, even as its share price surged nearly 20% in a single day. This shift has prompted a reassessment of the stock’s price attractiveness, especially when compared with its historical averages and peer group valuations within the Non Banking Financial Company (NBFC) sector.
Read full news article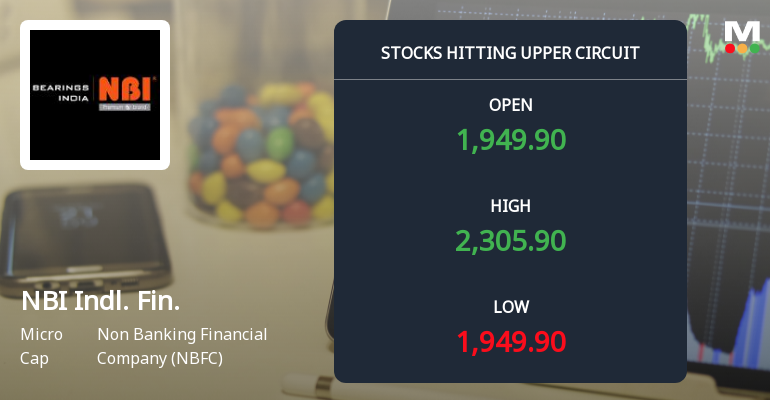
NBI Industrial Finance Company Ltd Locks at Upper Circuit With 18.13% Gain — Buyers Queue, Sellers Absent
2026-07-10 11:00:14At Rs 2,255.9, the buying was done — not because demand dried up, but because the exchange wouldn't let the stock go any higher. NBI Industrial Finance Company Ltd locked at its upper circuit of 20% on 09 Jul 2026, with buyers queuing and no sellers willing to part with shares.
Read full news article
NBI Industrial Finance Company Ltd: Technical Momentum Shifts Amid Bearish Sentiment
2026-07-06 08:02:14NBI Industrial Finance Company Ltd (NSE: 688217), a micro-cap player in the Non Banking Financial Company (NBFC) sector, has experienced a subtle shift in its technical momentum, moving from a bearish to a mildly bearish stance. Despite a modest day gain of 1.71%, the company’s overall technical indicators and fundamental returns continue to signal caution for investors, with a recent downgrade to a Strong Sell rating by MarketsMOJO.
Read full news article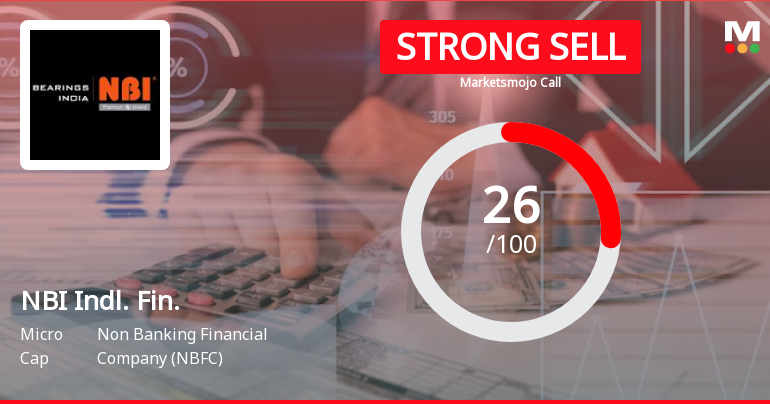
NBI Industrial Finance Company Ltd is Rated Strong Sell
2026-07-02 10:11:12NBI Industrial Finance Company Ltd is rated Strong Sell by MarketsMOJO, with this rating last updated on 01 July 2026. However, the analysis and financial metrics discussed here reflect the stock’s current position as of 02 July 2026, providing investors with the latest insights into the company’s fundamentals, valuation, financial trends, and technical outlook.
Read full news article
NBI Industrial Finance Company Ltd Faces Bearish Momentum Amid Technical Deterioration
2026-07-02 08:05:30NBI Industrial Finance Company Ltd, a micro-cap player in the Non Banking Financial Company (NBFC) sector, has seen a notable shift in its technical momentum, with its MarketsMOJO grade downgraded from Sell to Strong Sell as of 1 July 2026. The stock’s price action and technical indicators reveal a bearish tilt, reflecting growing investor caution amid broader sectoral and market pressures.
Read full news article
NBI Industrial Finance Company Ltd is Rated Sell
2026-06-21 10:10:35NBI Industrial Finance Company Ltd is rated 'Sell' by MarketsMOJO, with this rating last updated on 08 June 2026. However, the analysis and financial metrics discussed here reflect the stock's current position as of 21 June 2026, providing investors with the most up-to-date view of the company’s fundamentals, returns, and market performance.
Read full news article
NBI Industrial Finance Company Ltd: Technical Momentum Shifts Amidst Bearish Sentiment
2026-06-16 08:04:21NBI Industrial Finance Company Ltd, a micro-cap player in the Non Banking Financial Company (NBFC) sector, has experienced a subtle shift in its technical momentum, moving from a strongly bearish stance to a mildly bearish trend. Despite this slight improvement, the company’s technical indicators continue to reflect caution, with mixed signals from MACD, RSI, and moving averages underscoring the challenges ahead for investors.
Read full news article
NBI Industrial Finance Company Ltd Faces Bearish Momentum Amid Technical Indicator Shifts
2026-06-11 08:03:10NBI Industrial Finance Company Ltd, a micro-cap player in the Non Banking Financial Company (NBFC) sector, has witnessed a notable shift in its technical momentum, moving from a mildly bearish stance to a more pronounced bearish trend. Despite some mildly bullish signals on weekly indicators, the overall technical landscape remains cautious, reflecting the stock’s challenging performance relative to broader market benchmarks.
Read full news articleFinancial Result Updates
17-Sep-2019 | Source : NSE
| N. B. I. Industrial Finance Company Limited has submitted to the Exchange, the financial results for the period ended June 30, 2019. |
Reasons for Delayed\/Non-submission of Financial Results
03-Sep-2019 | Source : NSE
| N. B. I. Industrial Finance Company Limited has informed the Exchange that NSE mail ref : NSE/LIST/FR/89160IND ?? AS have become applicable to the Company w.e.f. 1st quarter of FY 2019-20. The Company has notified NSE that quarterly results for quarter ended 30th June 2019 would be submitted by 14th September i.e. within one month of the due date in accordance with SEBI Circular No. CIR/CFD/FAC/62/2016 dated July 05, 2016 after approval of our Board. NSE has been notified of deferment of submission of the results vide Notice dated 13.08.2019 filed in NEAPS App. No. 2019/Aug/4404/4562Thanks,Team NBI |
Trading Window
03-Aug-2019 | Source : NSE
| N. B. I. Industrial Finance Company Limited has informed the Exchange regarding the Trading Window closure pursuant to SEBI (Prohibition of Insider Trading) Regulations, 2015 |
Corporate Actions

No Upcoming Board Meetings

NBI Industrial Finance Company Ltd has declared 10% dividend, ex-date: 14 Aug 25

NBI Industrial Finance Company Ltd has announced 5:10 stock split, ex-date: 07 Dec 17

No Bonus history available

No Rights history available


