
Compare NCL Res. & Finl. with Similar Stocks
Stock DNA
Non Banking Financial Company (NBFC)
INR 56 Cr (Micro Cap)
NA (Loss Making)
21
0.00%
0.00
-2.28%
0.50
Total Returns (Price + Dividend) 
Latest dividend: 0.005 per share ex-dividend date: Sep-04-2014
Risk Adjusted Returns v/s
Returns Beta

News
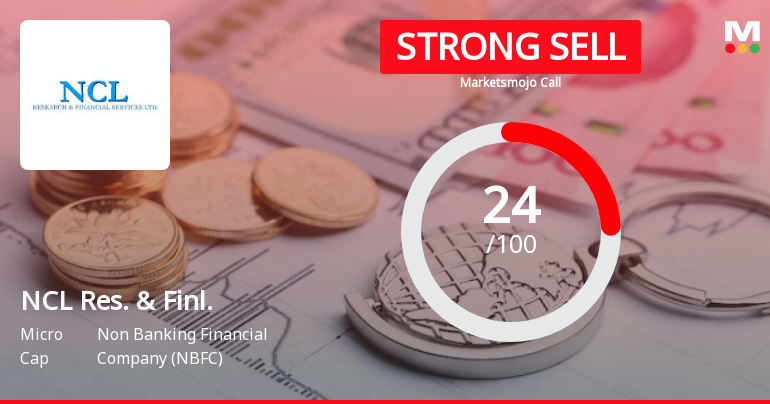
NCL Research and Financial Services Ltd is Rated Strong Sell
NCL Research and Financial Services Ltd is rated Strong Sell by MarketsMOJO, with this rating last updated on 13 April 2026. However, the analysis and financial metrics presented here reflect the stock’s current position as of 18 June 2026, providing investors with an up-to-date view of the company’s fundamentals, returns, and overall outlook.
Read full news article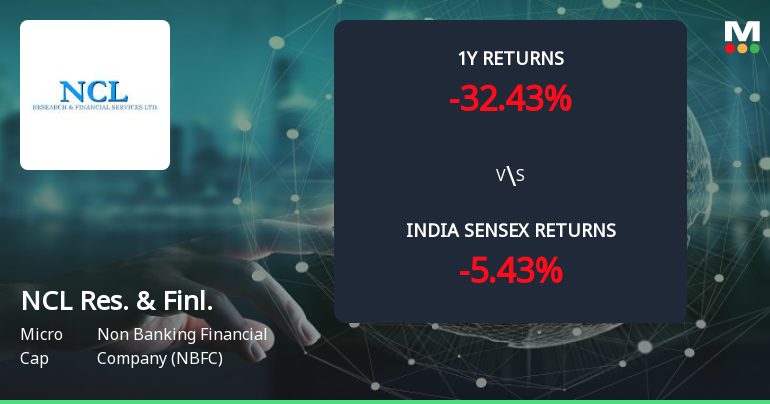
Golden Cross Forms in NCL Research and Financial Services Ltd — On a Day the Stock Stalled. What the Mixed Signals Mean
The 50-day moving average has crossed above the 200-day moving average for NCL Research and Financial Services Ltd, signalling a golden cross on 17 Jun 2026. Yet, the stock price remained flat on the day, and monthly technical indicators remain bearish. This divergence between the moving averages and other signals calls for a closer examination of the cross's reliability.
Read full news article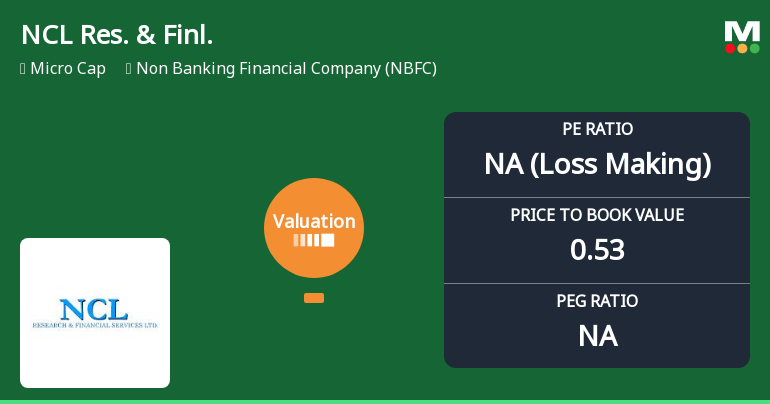
NCL Research and Financial Services Ltd Faces Valuation Shift Amid Deteriorating Fundamentals
NCL Research and Financial Services Ltd, a micro-cap player in the Non Banking Financial Company (NBFC) sector, has seen a marked deterioration in its valuation parameters, shifting from an attractive to a risky profile. This change, coupled with a recent downgrade to a Strong Sell rating and a Mojo Score of 9.0, underscores growing investor caution amid challenging financial metrics and subdued market performance.
Read full news article Announcements
Announcement under Regulation 30 (LODR)-Newspaper Publication
01-Jun-2026 | Source : BSEPlease find attached Newspaper cuttings of publication of Audited Financial Results for QE/YE March 31 2026
Results - Audited Financial Results For QE/YE March 31 2026
29-May-2026 | Source : BSEPlease find attached Audited Financial Results for QE/YE March 31 2026
Board Meeting Intimation for Approval Of Audited Financial Results For QE/YE March 31 2026
22-Apr-2026 | Source : BSENCL Research & Financial Services Ltdhas informed BSE that the meeting of the Board of Directors of the Company is scheduled on 29/05/2026 inter alia to consider and approve Audited Financial Results for QE/YE March 31 2026
Corporate Actions

No Upcoming Board Meetings

NCL Research and Financial Services Ltd has declared 5% dividend, ex-date: 04 Sep 14

NCL Research and Financial Services Ltd has announced 1:2 stock split, ex-date: 02 Dec 21

NCL Research and Financial Services Ltd has announced 1:1 bonus issue, ex-date: 02 Dec 21

NCL Research and Financial Services Ltd has announced 21:25 rights issue, ex-date: 06 May 22
Quality key factors
Valuation key factors
Technicals key factors
 Technical Indicator Scale: Bearish, Mildly Bearish, Sideways, Mildly Bullish, Bullish Turned
 Shareholding Snapshot : Mar 2026
Shareholding Compare (%holding)
Non Institution
None
Held by 0 Schemes
Held by 0 FIIs
None
Katyani Commodities Private Limited (1.39%)
91.79%
Quarterly Results Snapshot (Standalone) - Mar'26 - QoQ

QoQ Growth in quarter ended Mar 2026 is -86.85% vs 10.36% in Dec 2025
QoQ Growth in quarter ended Mar 2026 is -1,463.41% vs -58.16% in Dec 2025
Half Yearly Results Snapshot (Standalone) - Sep'25

Growth in half year ended Sep 2025 is 30.66% vs 26.43% in Sep 2024
Growth in half year ended Sep 2025 is 350.47% vs -434.38% in Sep 2024
Nine Monthly Results Snapshot (Standalone) - Dec'25
YoY Growth in nine months ended Dec 2025 is -9.82% vs 87.36% in Dec 2024
YoY Growth in nine months ended Dec 2025 is 313.10% vs -205.84% in Dec 2024
Annual Results Snapshot (Standalone) - Mar'26
YoY Growth in year ended Mar 2026 is -27.78% vs -20.21% in Mar 2025
YoY Growth in year ended Mar 2026 is -91.18% vs -184.47% in Mar 2025
About NCL Research and Financial Services Ltd

Company Coordinates


