
Compare Nectar Lifesci. with Similar Stocks
Dashboard
With a Operating Losses, the company has a Weak Long Term Fundamental Strength
- Low ability to service debt as the company has a high Debt to EBITDA ratio of -458.84 times
- The company has been able to generate a Return on Equity (avg) of 0.67% signifying low profitability per unit of shareholders funds
Flat results in Mar 26
Risky - Negative EBITDA
Below par performance in long term as well as near term
Stock DNA
Pharmaceuticals & Biotechnology
INR 220 Cr (Micro Cap)
NA (Loss Making)
33
0.00%
-0.21
-20.51%
0.39
Total Returns (Price + Dividend) 
Latest dividend: 0.05 per share ex-dividend date: Sep-11-2020
Risk Adjusted Returns v/s
Returns Beta

News

Nectar Lifescience Ltd is Rated Strong Sell
Nectar Lifescience Ltd is rated Strong Sell by MarketsMOJO, with this rating last updated on 08 July 2025. However, the analysis and financial metrics presented here reflect the stock's current position as of 11 June 2026, providing investors with an up-to-date view of the company’s fundamentals, returns, and market performance.
Read full news article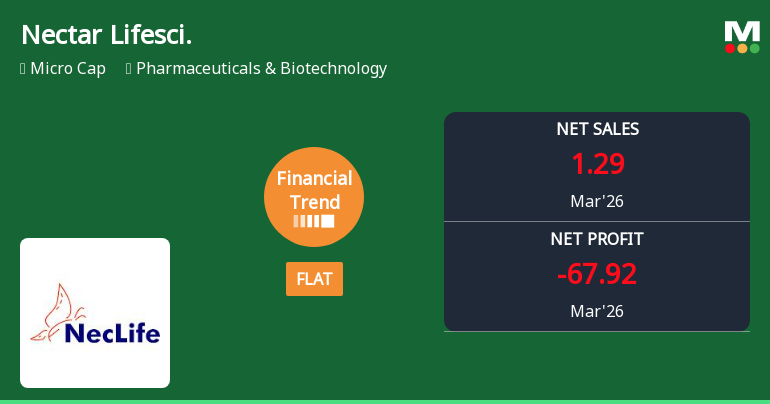
Nectar Lifescience Ltd Reports Flat Quarterly Performance Amidst Margin Pressures
Nectar Lifescience Ltd reported a flat financial performance for the quarter ended March 2026, marking a notable improvement from previous negative trends but still reflecting significant operational challenges. Despite a stabilisation in revenue growth, the company’s profitability metrics deteriorated sharply, underscoring persistent margin pressures in a competitive pharmaceutical sector.
Read full news articleAre Nectar Lifescience Ltd latest results good or bad?
Nectar Lifescience Ltd's latest financial results for Q4 FY26 reveal significant operational challenges and a concerning financial trajectory. The company reported a consolidated net loss of ₹67.92 crores, which marks a substantial deterioration compared to previous periods. Standalone results also reflect a net loss of ₹37.21 crores, a stark contrast to a profit of ₹0.30 crores in the prior quarter, indicating a severe decline in profitability. Revenue generation remains critically low, with standalone revenue reported at just ₹1.29 crores, showing minimal recovery from the previous quarter's ₹0.00 crores. This erratic revenue pattern raises questions about the company's operational stability and market demand for its products. The operating profit before depreciation, interest, and tax (PBDIT) fell to a record loss of ₹57.24 crores, illustrating a complete operational breakdown. The company’s financial ...
Read full news article Announcements
Announcement under Regulation 30 (LODR)-Newspaper Publication
01-Jun-2026 | Source : BSEPlease find attached herewith the copy of newspapers for publication of financial results of the Company for the quarter and financial year ended on March 31 2026
Financial Results For The Year 2025-26
30-May-2026 | Source : BSEFinancial Results for the Year 2025-26
Board Meeting Intimation for Audited Financial Results And Other Business Matters
25-May-2026 | Source : BSENectar Lifesciences Ltdhas informed BSE that the meeting of the Board of Directors of the Company is scheduled on 30/05/2026 inter alia to consider and approve the Audited Financial Results for the Financial Year 2025- 26 Financial Statement of the Company for the Financial Year 2025-26 and matters related thereto
Corporate Actions

No Upcoming Board Meetings

Nectar Lifescience Ltd has declared 5% dividend, ex-date: 11 Sep 20

Nectar Lifescience Ltd has announced 1:10 stock split, ex-date: 12 Nov 08

No Bonus history available

No Rights history available
Quality key factors
Valuation key factors
Technicals key factors
 Technical Indicator Scale: Bearish, Mildly Bearish, Sideways, Mildly Bullish, Bullish Turned
 Shareholding Snapshot : Mar 2026
Shareholding Compare (%holding)
Promoters
None
Held by 2 Schemes (0.0%)
Held by 10 FIIs (0.6%)
Sanjiv Goyal (24.63%)
Rajasthan Global Securities Private Limited (4.01%)
36.23%
Quarterly Results Snapshot (Consolidated) - Mar'26 - QoQ

QoQ Growth in quarter ended Mar 2026 is 0.00% vs -100.00% in Dec 2025

QoQ Growth in quarter ended Mar 2026 is -575.96% vs 108.11% in Dec 2025
Half Yearly Results Snapshot (Consolidated) - Sep'25
Growth in half year ended Sep 2025 is 4.89% vs -98.68% in Sep 2024
Growth in half year ended Sep 2025 is -2,891.60% vs 201.76% in Sep 2024
Nine Monthly Results Snapshot (Consolidated) - Dec'25
YoY Growth in nine months ended Dec 2025 is 4.78% vs -99.16% in Dec 2024
YoY Growth in nine months ended Dec 2025 is -1,470.93% vs 272.11% in Dec 2024
Annual Results Snapshot (Consolidated) - Mar'26
YoY Growth in year ended Mar 2026 is -90.59% vs -98.73% in Mar 2025
YoY Growth in year ended Mar 2026 is -157.64% vs -2,378.16% in Mar 2025
About Nectar Lifescience Ltd

Company Coordinates


