
Compare Nephrocare Healt with Similar Stocks
Dashboard
The company is Net-Debt Free
Healthy long term growth as Net Sales has grown by an annual rate of 0% and Operating profit at 0%
Positive results in Mar 26
With ROE of 6.9, it has a Very Expensive valuation with a 5.8 Price to Book Value
Increasing Participation by Institutional Investors
Stock DNA
Healthcare Services
INR 6,310 Cr (Small Cap)
83.00
62
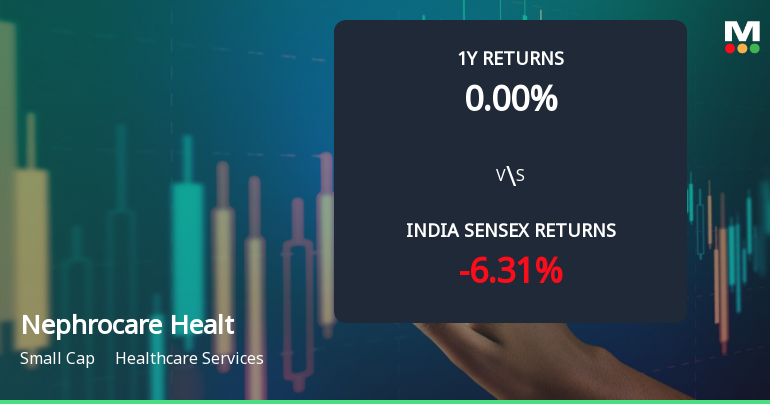
0.00%
-0.31
6.88%
5.80
Total Returns (Price + Dividend) 
Nephrocare Healt for the last several years.
Risk Adjusted Returns v/s
Returns Beta

News
Nephrocare Health Services Ltd Technical Momentum Shifts Amid Mixed Market Signals
Nephrocare Health Services Ltd has experienced a notable shift in its technical momentum, transitioning from a mildly bullish trend to a sideways movement. This change comes amid a backdrop of mixed returns relative to the broader Sensex index, with the stock showing strong year-to-date gains despite recent short-term declines. Investors and analysts are closely monitoring key technical indicators such as MACD, RSI, and moving averages to gauge the stock’s near-term trajectory within the healthcare services sector.
Read full news article
Nephrocare Health Services Ltd Shows Mildly Bullish Momentum Amid Technical Upgrade
Nephrocare Health Services Ltd has shifted from a sideways to a mildly bullish technical trend, supported by positive momentum indicators and an upgrade in its Mojo Grade from Sell to Hold. The stock’s recent price action, combined with improving technical signals, suggests cautious optimism for investors in this small-cap healthcare services company.
Read full news article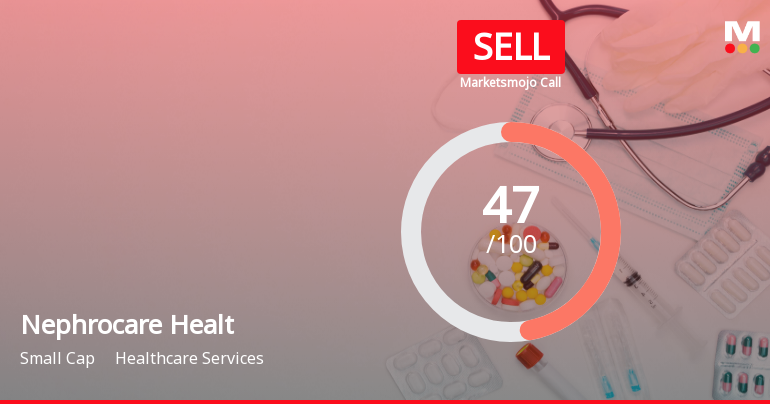
Nephrocare Health Services Ltd is Rated Sell
Nephrocare Health Services Ltd is rated 'Sell' by MarketsMOJO, with this rating last updated on 29 June 2026. However, the analysis and financial metrics discussed here reflect the stock's current position as of 05 July 2026, providing investors with the latest insights into its performance and outlook.
Read full news article Announcements
Compliances-Certificate under Reg. 74 (5) of SEBI (DP) Regulations 2018
07-Jul-2026 | Source : BSEWe are enclosing herewith a certificate under Reg 74(5) of SEBI (DP) Regulations 2018 for quarter ended 30th June 2026 received from M/s. KFIN Technologies Limited.
Issuance Of Standby Letter Of Credit Facilities
06-Jul-2026 | Source : BSEThis is to inform that the company has provided collateral/security support by issuance of SBLC as per the details disclosed herewith.
Announcement under Regulation 30 (LODR)-Memorandum of Understanding /Agreements
25-Jun-2026 | Source : BSEPursuant to Reg 30 of SEBI LODR Regulations 2015 we hereby inform that Nephrocare Health Services philippines Inc. overseas step-down wholly owned subsidiary of the company has acquired a Dialysis Centre and has executed Asset Transfer Agreement as per the disclosure annexed herewith.
Corporate Actions

No Upcoming Board Meetings

No Dividend history available

No Splits history available

No Bonus history available

No Rights history available
Quality key factors
Valuation key factors
Technicals key factors
 Technical Indicator Scale: Bearish, Mildly Bearish, Sideways, Mildly Bullish, Bullish Turned
 Shareholding Snapshot : Mar 2026
Shareholding Compare (%holding)
Promoters
None
Held by 7 Schemes (3.17%)
Held by 20 FIIs (9.94%)
Edoras Investment Holdings Pte Ltd (28.3%)
Investcorp India Investments Holding Limited (6.29%)
5.08%
Quarterly Results Snapshot (Standalone) - Mar'26 - QoQ

QoQ Growth in quarter ended Mar 2026 is 2.28% vs 3.04% in Dec 2025
QoQ Growth in quarter ended Mar 2026 is 28.88% vs 126.07% in Dec 2025
Annual Results Snapshot (Standalone) - Mar'26
Not Applicable: The company has declared_date for only one period
Not Applicable: The company has declared_date for only one period
About Nephrocare Health Services Ltd

Company Coordinates


