
Compare Netwrk.18 Media with Similar Stocks
Dashboard
High Debt company with Weak Long Term Fundamental Strength
- Poor long term growth as Net Sales has grown by an annual rate of -14.73% and Operating profit at -167.19% over the last 5 years
- High Debt Company with a Debt to Equity ratio (avg) of 2.40 times
- The company has been able to generate a Return on Equity (avg) of 5.64% signifying low profitability per unit of shareholders funds
Flat results in Mar 26
Risky - Negative Operating Profits
Despite the size of the company, domestic mutual funds hold only 0.3% of the company
Stock DNA
Media & Entertainment
INR 5,013 Cr (Small Cap)
146.00
21
0.00%
0.64
0.70%
0.99
Total Returns (Price + Dividend) 
Latest dividend: 1.25 per share ex-dividend date: Feb-14-2008
Risk Adjusted Returns v/s
Returns Beta

News

Network 18 Media & Investments Ltd is Rated Strong Sell
Network 18 Media & Investments Ltd is rated Strong Sell by MarketsMOJO. This rating was last updated on 18 April 2024. However, the analysis and financial metrics discussed below reflect the company’s current position as of 14 June 2026, providing investors with an up-to-date perspective on the stock’s fundamentals, valuation, financial trends, and technical outlook.
Read full news article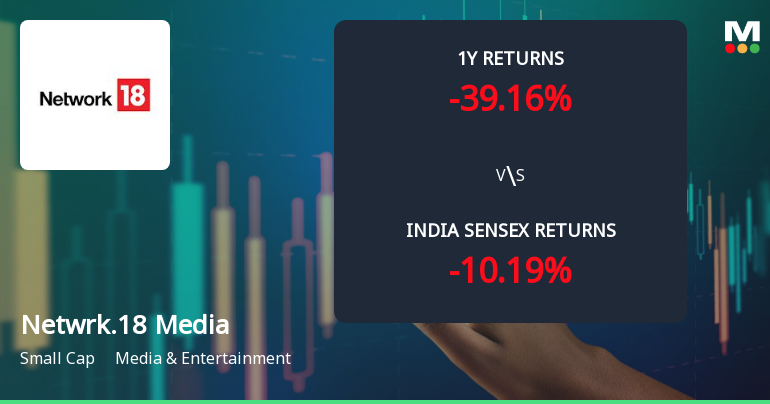
Network 18 Media & Investments Ltd Sees Mixed Technical Signals Amid Price Momentum Shift
Network 18 Media & Investments Ltd has experienced a notable shift in price momentum, reflected in a complex interplay of technical indicators that suggest a transition from bearish to mildly bearish trends. Despite a strong intraday gain of 11.56%, the stock remains under pressure over longer timeframes, with technical signals offering a nuanced outlook for investors navigating the Media & Entertainment sector.
Read full news article
Network 18 Media & Investments Ltd is Rated Strong Sell
Network 18 Media & Investments Ltd is rated Strong Sell by MarketsMOJO. This rating was last updated on 18 April 2024, reflecting a significant reassessment of the stock’s outlook. However, the analysis and financial metrics discussed below are based on the company’s current position as of 03 June 2026, providing investors with an up-to-date view of its performance and prospects.
Read full news article Announcements
Clarification sought from Network 18 Media & Investments Ltd
08-Jun-2026 | Source : BSEThe Exchange has sought clarification from Network 18 Media & Investments Ltd on June 8 2026 with reference to Movement in Volume.
The reply is awaited.
Clarification With Respect To Increase In The Volume Of Shares
08-Jun-2026 | Source : BSEClarification with respect to increase in the volume of shares.
Announcement under Regulation 30 (LODR)-Newspaper Publication
12-May-2026 | Source : BSERegulation 30 of Securities and Exchange Board of India (Listing Obligations and Disclosure Requirements) Regulations 2015 - Newspaper Advertisement of Postal Ballot Notice
Corporate Actions

No Upcoming Board Meetings

Network 18 Media & Investments Ltd has declared 25% dividend, ex-date: 14 Feb 08

No Splits history available

No Bonus history available

Network 18 Media & Investments Ltd has announced 307:50 rights issue, ex-date: 11 Sep 12
Quality key factors
Valuation key factors
Technicals key factors
 Technical Indicator Scale: Bearish, Mildly Bearish, Sideways, Mildly Bullish, Bullish Turned
 Shareholding Snapshot : Mar 2026
Shareholding Compare (%holding)
Promoters
None
Held by 9 Schemes (0.13%)
Held by 87 FIIs (6.29%)
Rb Mediasoft Private Limited (9.25%)
Nexg Ventures India Pvt Ltd (4.63%)
23.71%
Quarterly Results Snapshot (Consolidated) - Mar'26 - YoY

YoY Growth in quarter ended Mar 2026 is 9.70% vs -76.80% in Mar 2025

YoY Growth in quarter ended Mar 2026 is -0.69% vs 72.48% in Mar 2025
Half Yearly Results Snapshot (Consolidated) - Sep'25
Growth in half year ended Sep 2025 is -80.55% vs -2.71% in Sep 2024
Growth in half year ended Sep 2025 is 185.30% vs -121.86% in Sep 2024
Nine Monthly Results Snapshot (Consolidated) - Dec'25
YoY Growth in nine months ended Dec 2025 is -76.21% vs -8.02% in Dec 2024
YoY Growth in nine months ended Dec 2025 is 111.03% vs -949.87% in Dec 2024
Annual Results Snapshot (Consolidated) - Mar'26
YoY Growth in year ended Mar 2026 is -69.21% vs -25.92% in Mar 2025
YoY Growth in year ended Mar 2026 is 109.02% vs -717.74% in Mar 2025
About Network 18 Media & Investments Ltd

Company Coordinates


